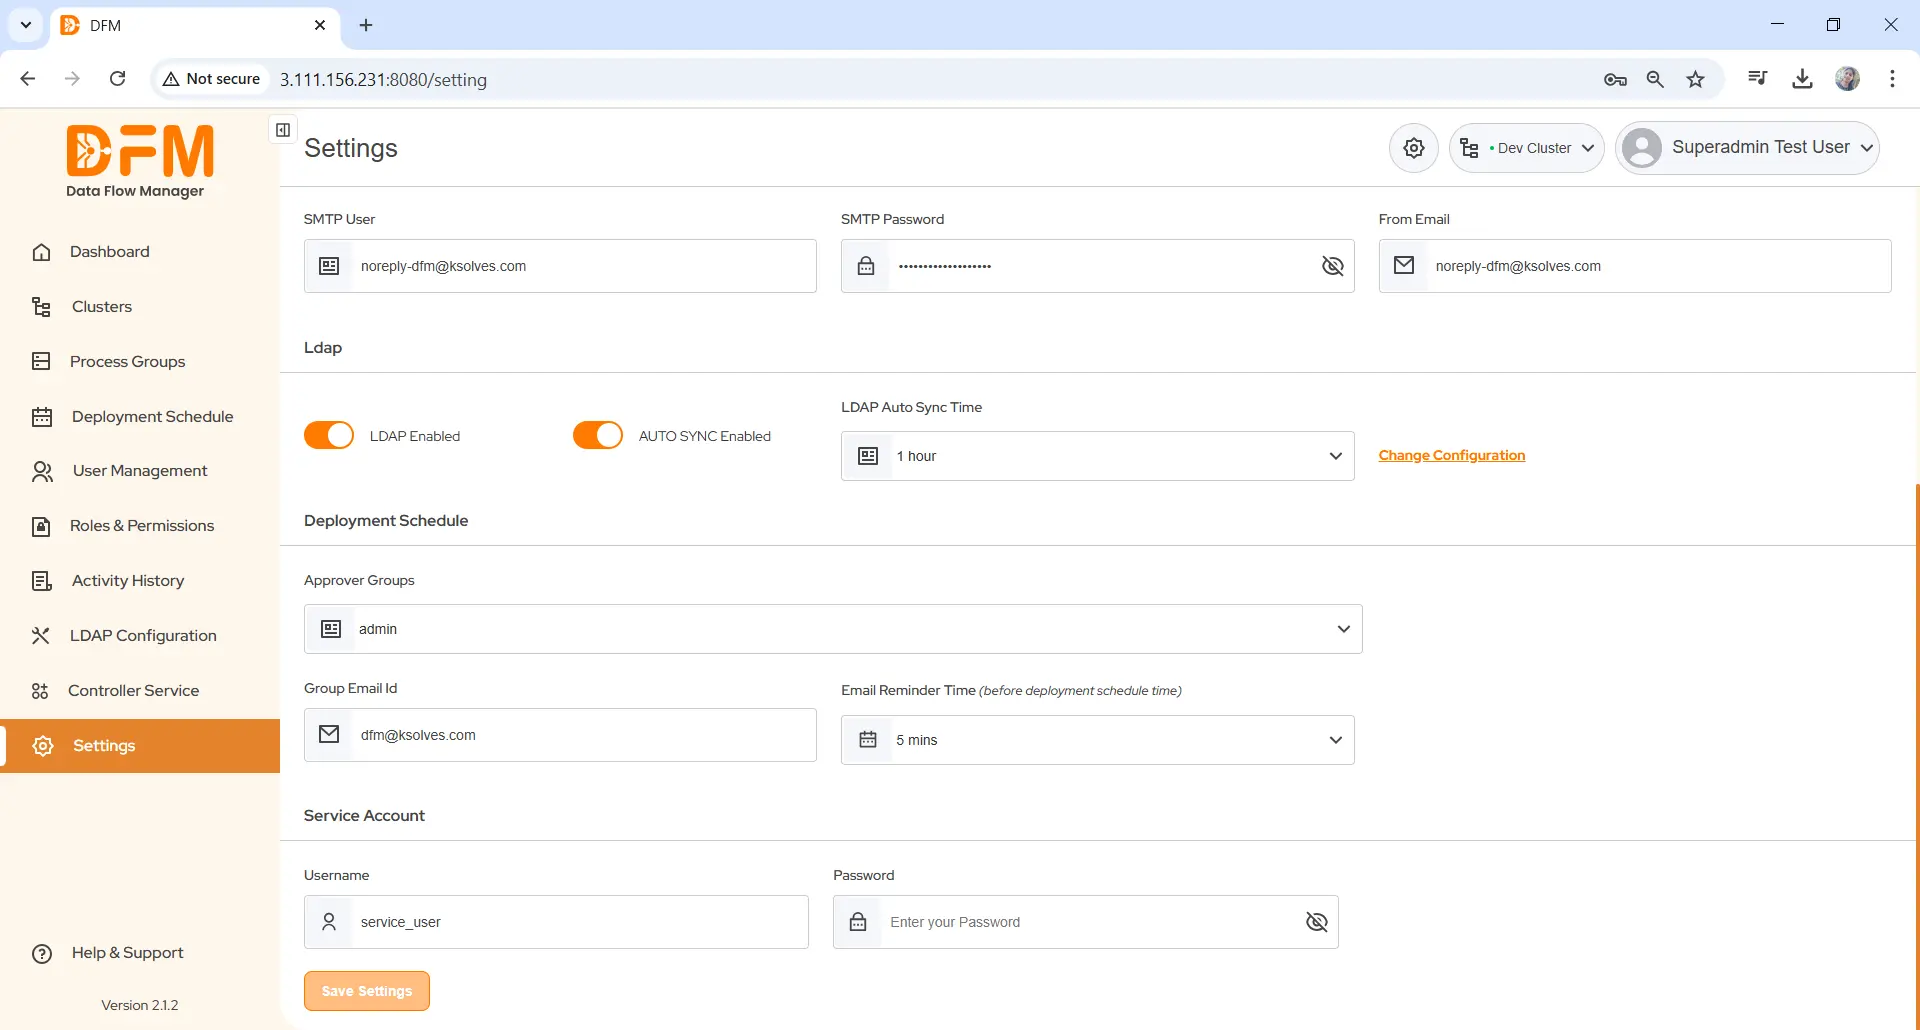
1. Components of Data Flow
Data Flow Manager consists of the following components:
- Dashboard: The home page showing system insights.
- Clusters: Manage and monitor clusters.
- Process Groups: Organize and manage process groups.
- Deployment Schedule: Manage scheduling for deployment workflows.
- User Management: Handle user access and permissions.
- Roles & Permissions: Configure roles and permissions for users.
- Activity History: View logs or history of system activities.
- LDAP Configuration: Manage LDAP integration for authentication.
- Controller Service: Configure and manage controller services.
Header Section
- Cluster Name: Displays the current cluster (e.g., "Dev Cluster") the user is working on.
- User Information: Displays the logged-in user.
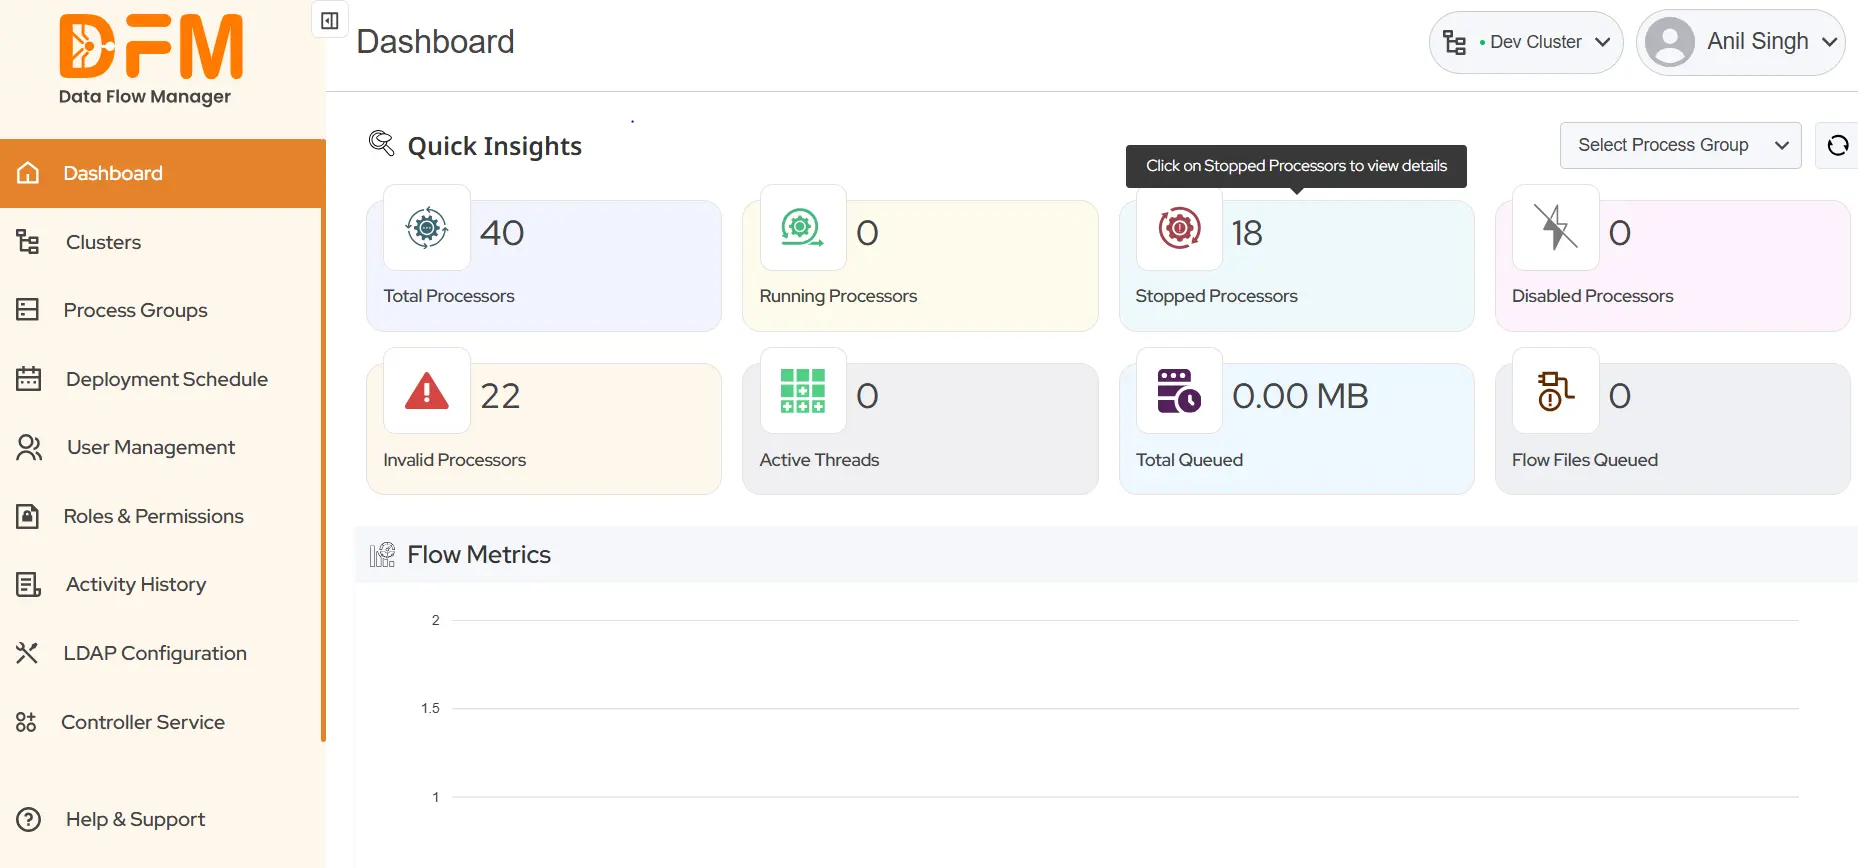
2. Dashboard
The dashboard provides an overview of the system’s operational state and allows navigation for detailed configuration and management.
2.1. Quick Insights
- Total Processors: The total number of processors configured in the system.
- Running Processors: The number of processors actively running.
- Stopped Processors: The number of processors currently stopped. You can click to view detailed information about them.
- Disabled Processors: The processors that are disabled and not operational.
- Invalid Processors: Processors that are invalid, likely due to incorrect configuration or missing resources.
- Active Threads: The number of active threads currently in use.
- Total Queued: The total size of data (in MB) queued in the processors.
- Flow Files Queued: The total number of flow files queued in the system.
2.2. Flow Metrics
A visual graph (not fully displayed in this section) likely shows metrics related to data flow over time.
3. Clusters
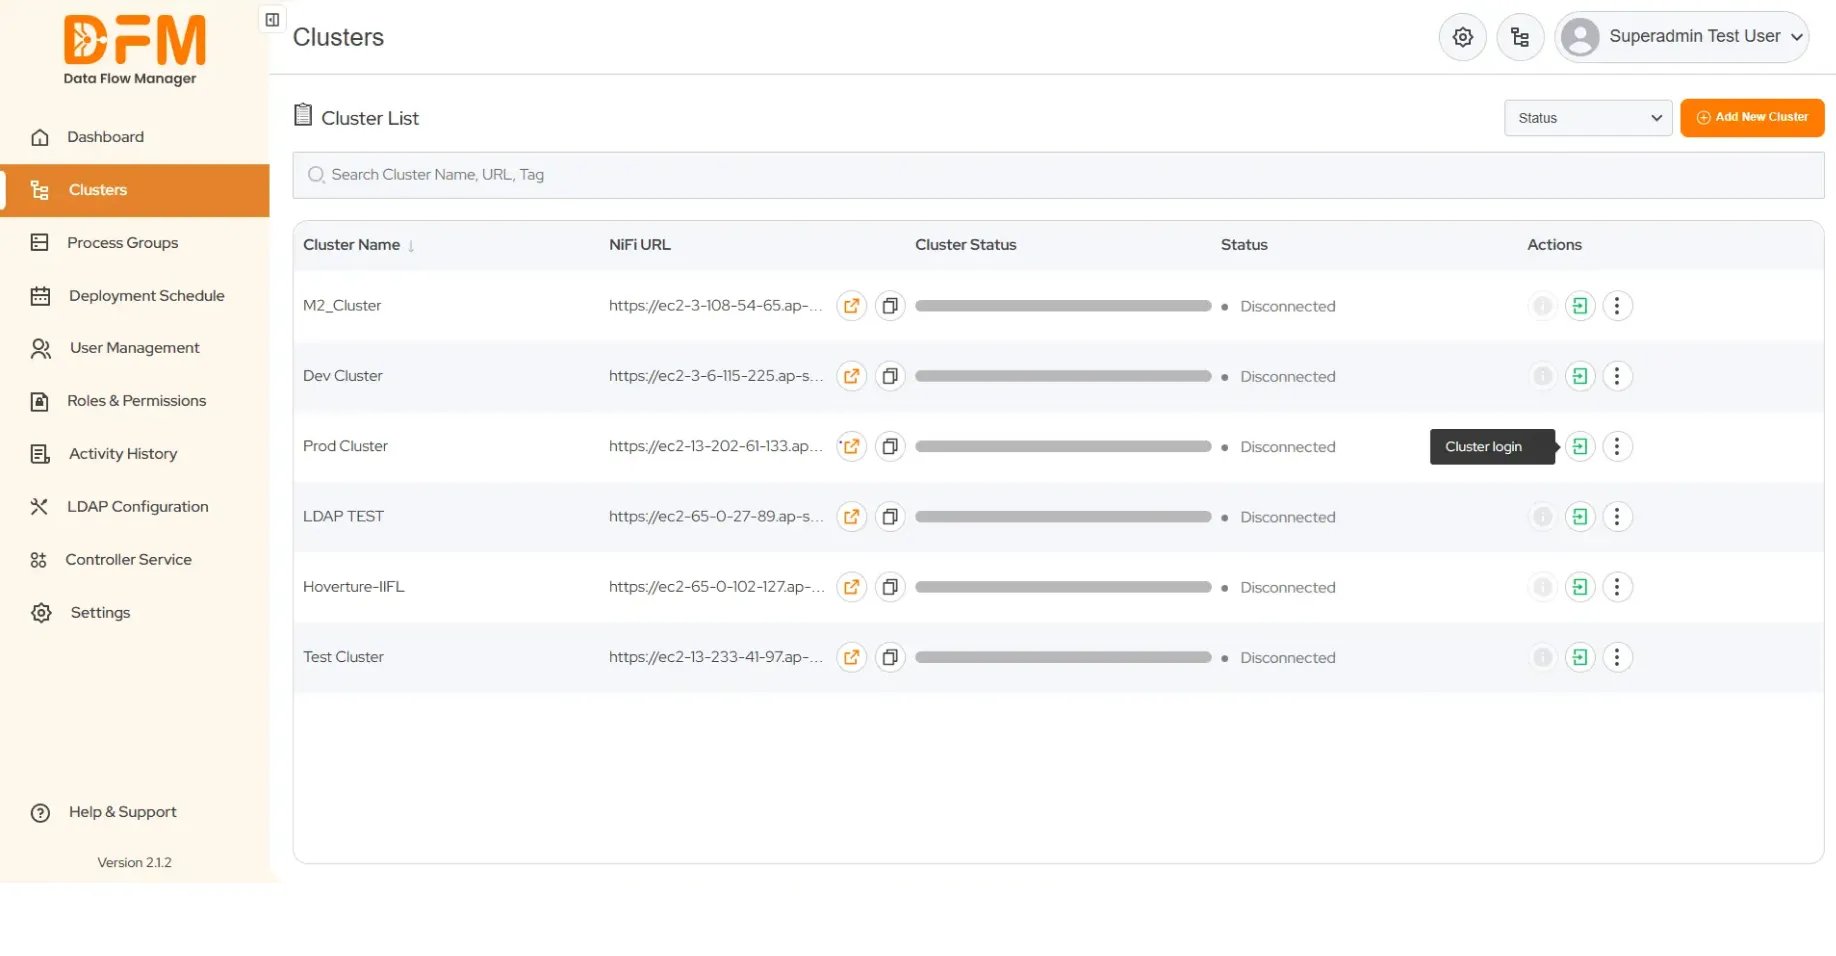
Under the Clusters tab, you’ll find a list of clusters from your NiFi instance. To deploy or upgrade data flows, you first need to log in to the respective clusters. However, if the required cluster is not available in the cluster list, you need to onboard it first.
It is important to note that if a user has only view access to the Clusters tab, they can only view the clusters. Users with write access can add, delete, or edit clusters.
3.1. How to log in to a specific cluster?
- Click on the Clusters tab to view the list of clusters.
- On the right side of each cluster, you'll find a green arrow indicating the option to log in to that specific cluster.
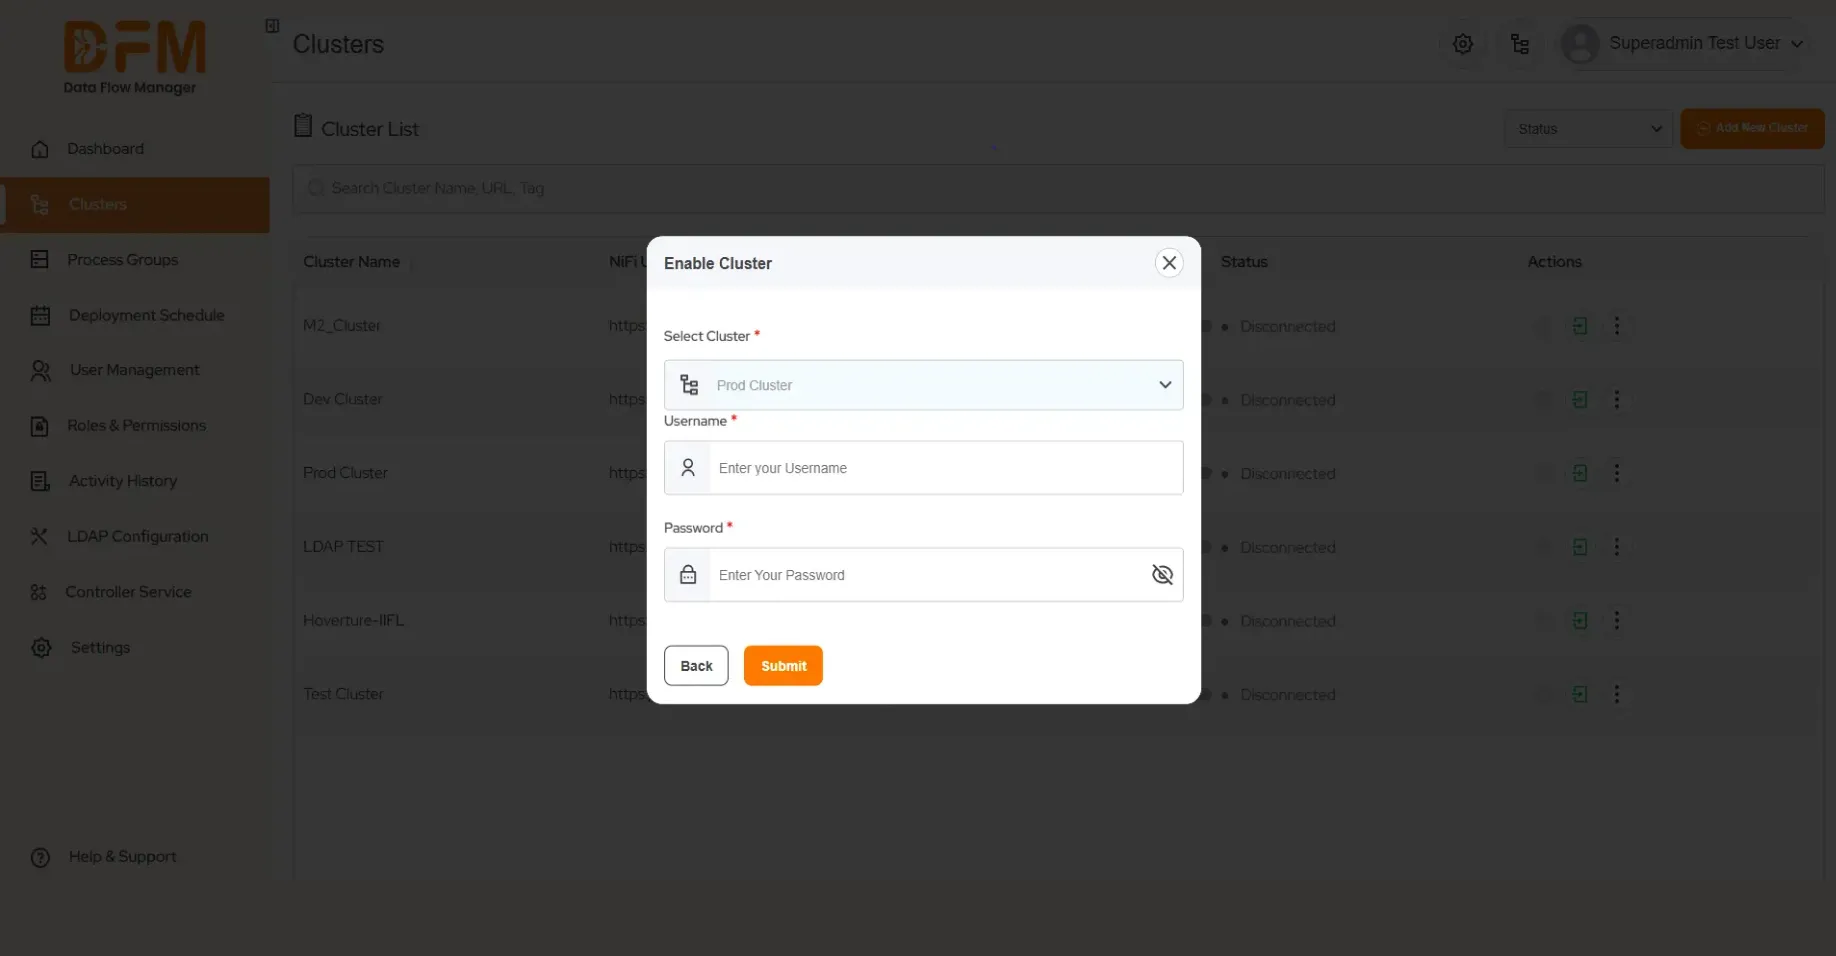
- Click the green arrow for the cluster you need to log in to. Here, we will log in to the ProdCluster.

- Enter the valid credentials and click Submit.
We’ve successfully logged into the cluster. The Cluster Status has changed to green.

You can log in to as many clusters as you want.
3.2. View node details of a cluster
Once you log into the cluster, check the number of total nodes and connected nodes. Under the Actions tab, click the info icon to view the node details of the cluster.
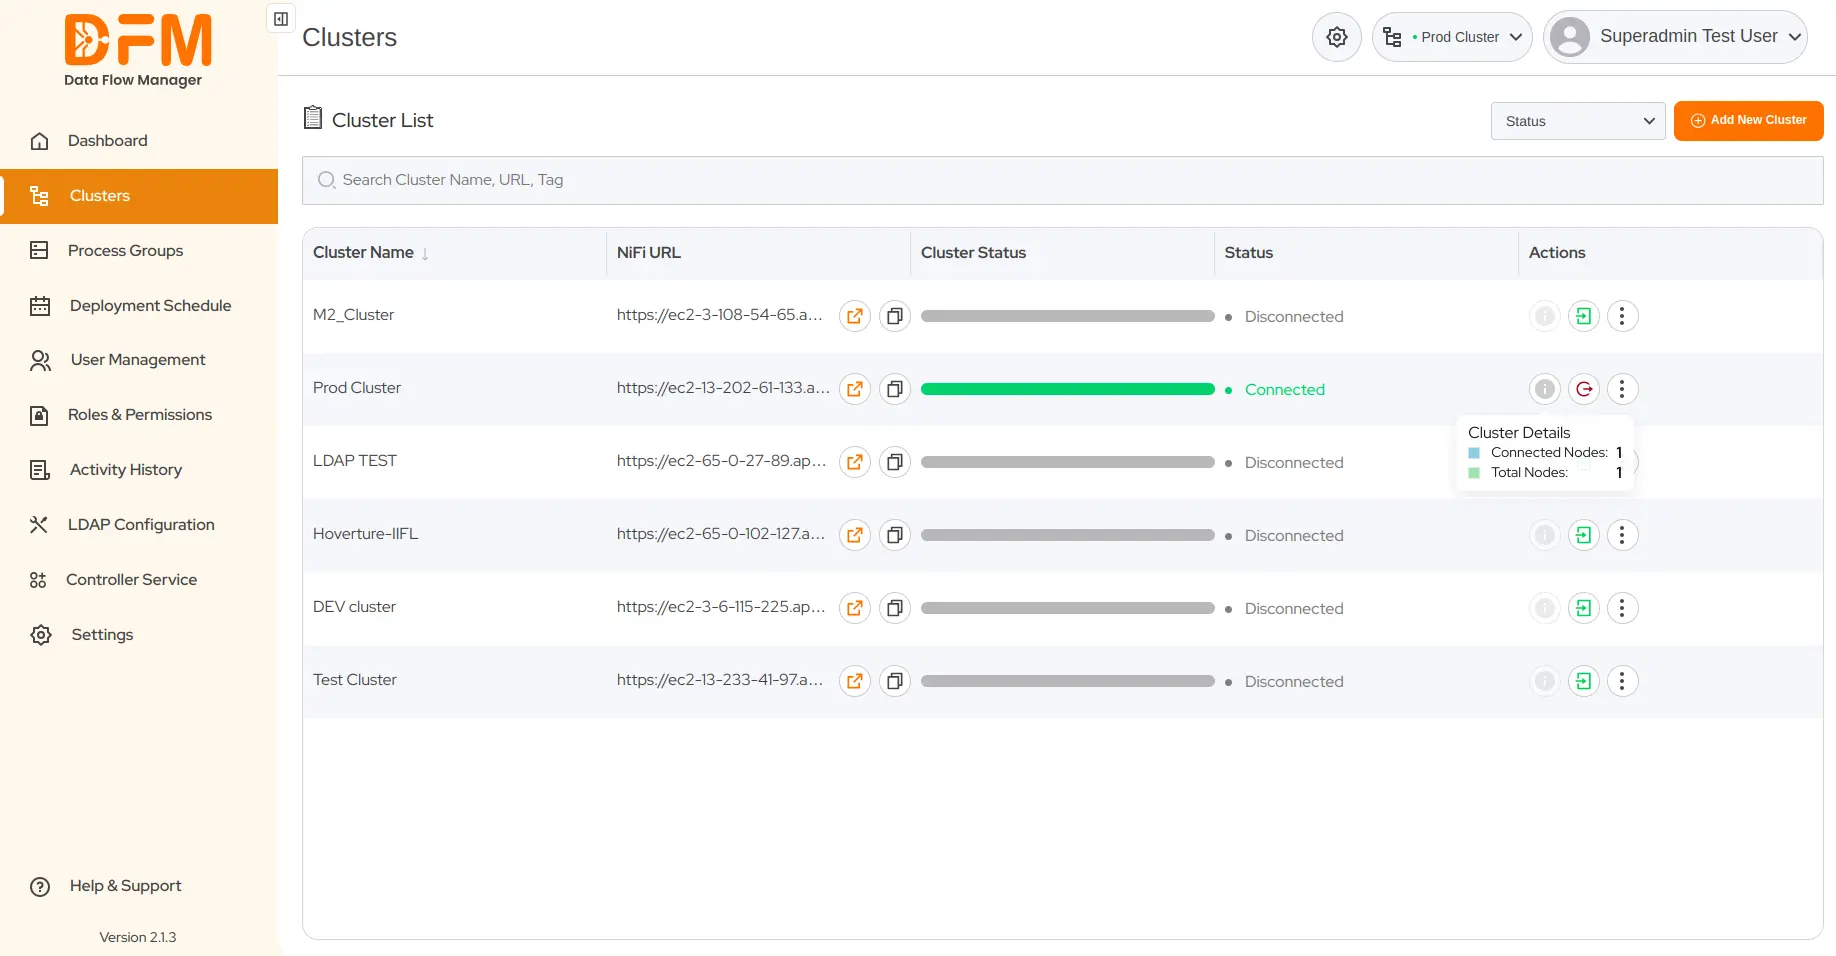
3.3. Perform different actions on the logged-in cluster
Once you're logged into a cluster, you can perform various operations, such as viewing and editing cluster details and deactivating the cluster. Find these options from the vertical ellipsis present on the right side of the cluster.
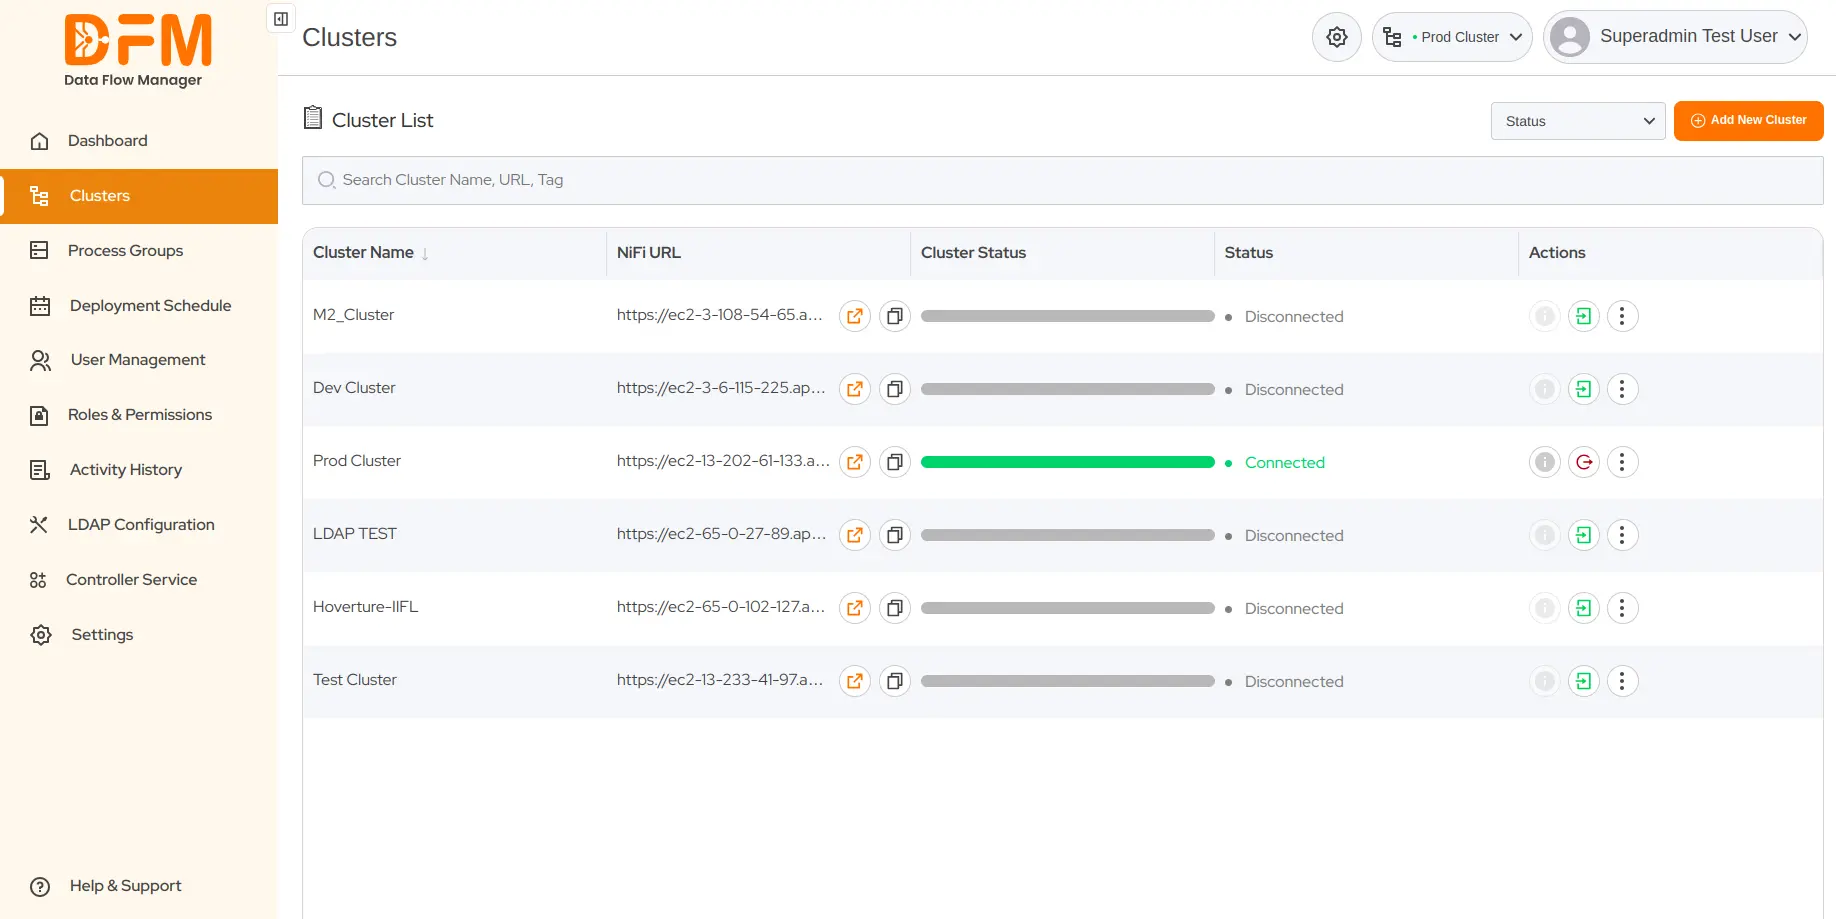
Note: Deactivating the cluster refers to soft delete. It will remove your cluster from the list, but underlying data and configurations remain intact.
Let us now see how to perform different actions on the cluster.
To view the cluster details:
- Click on the vertical ellipsis. Select the View option.
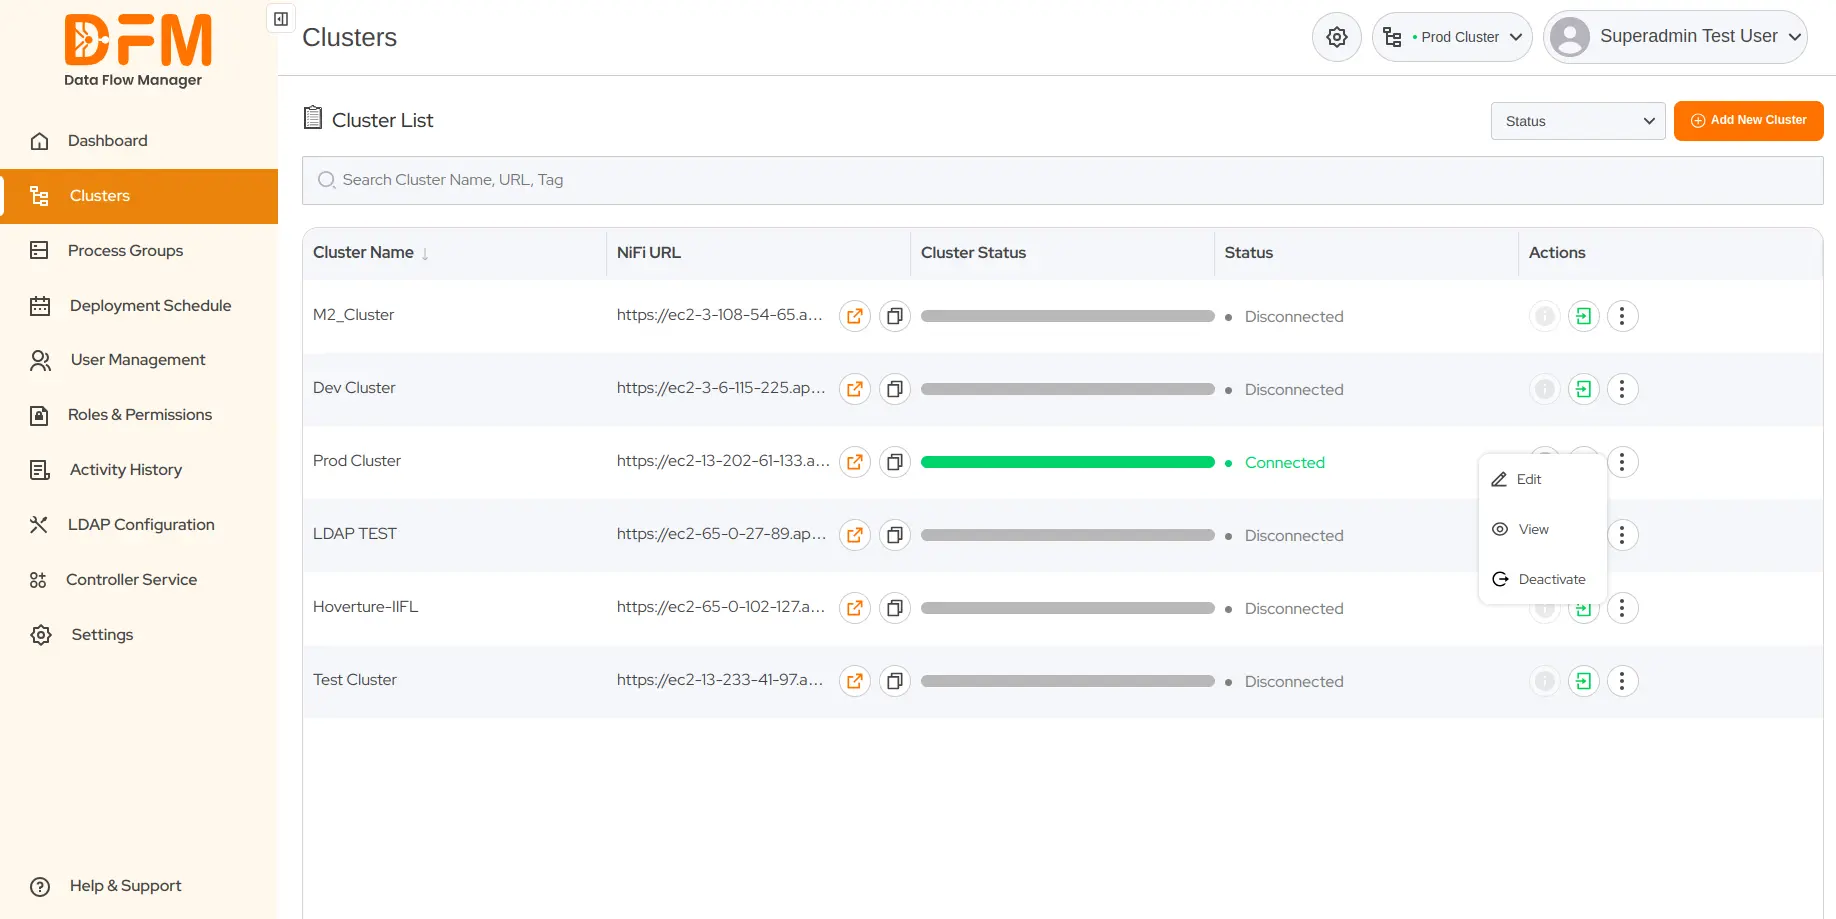
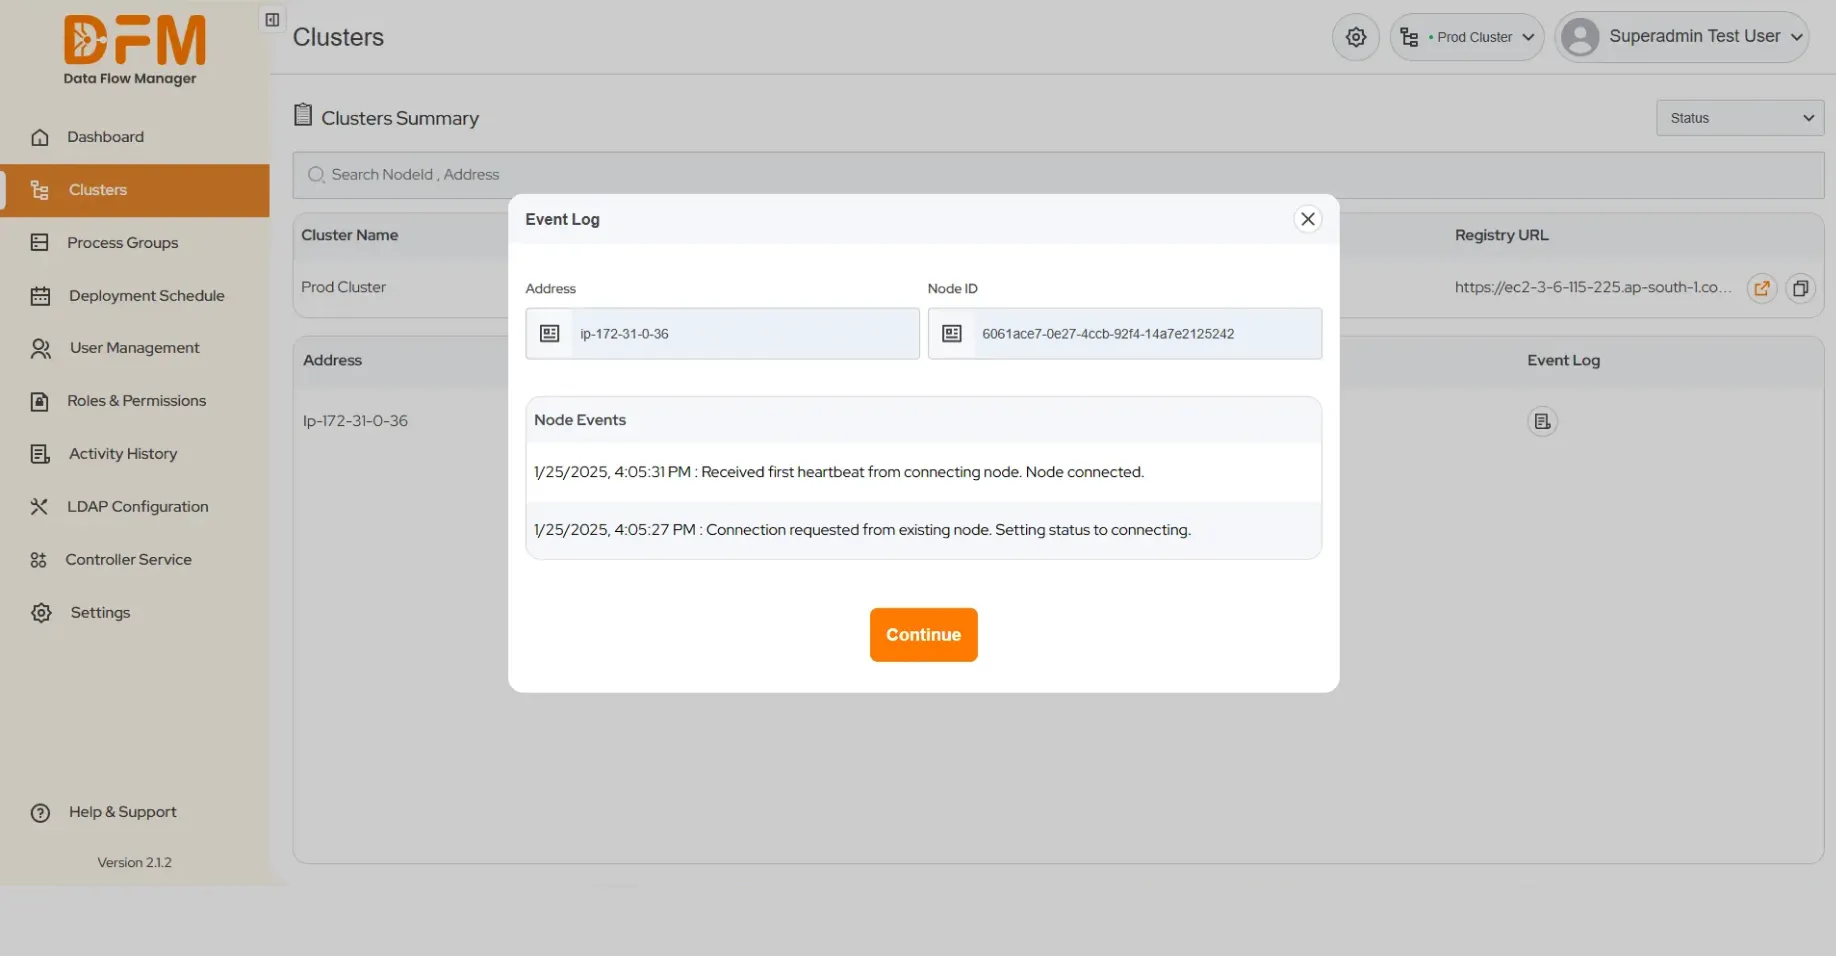
- You will find the details of the clusters, such as the cluster name, cluster URL, registry name, registry URL, address, node ID, heartbeat, status, and event log.
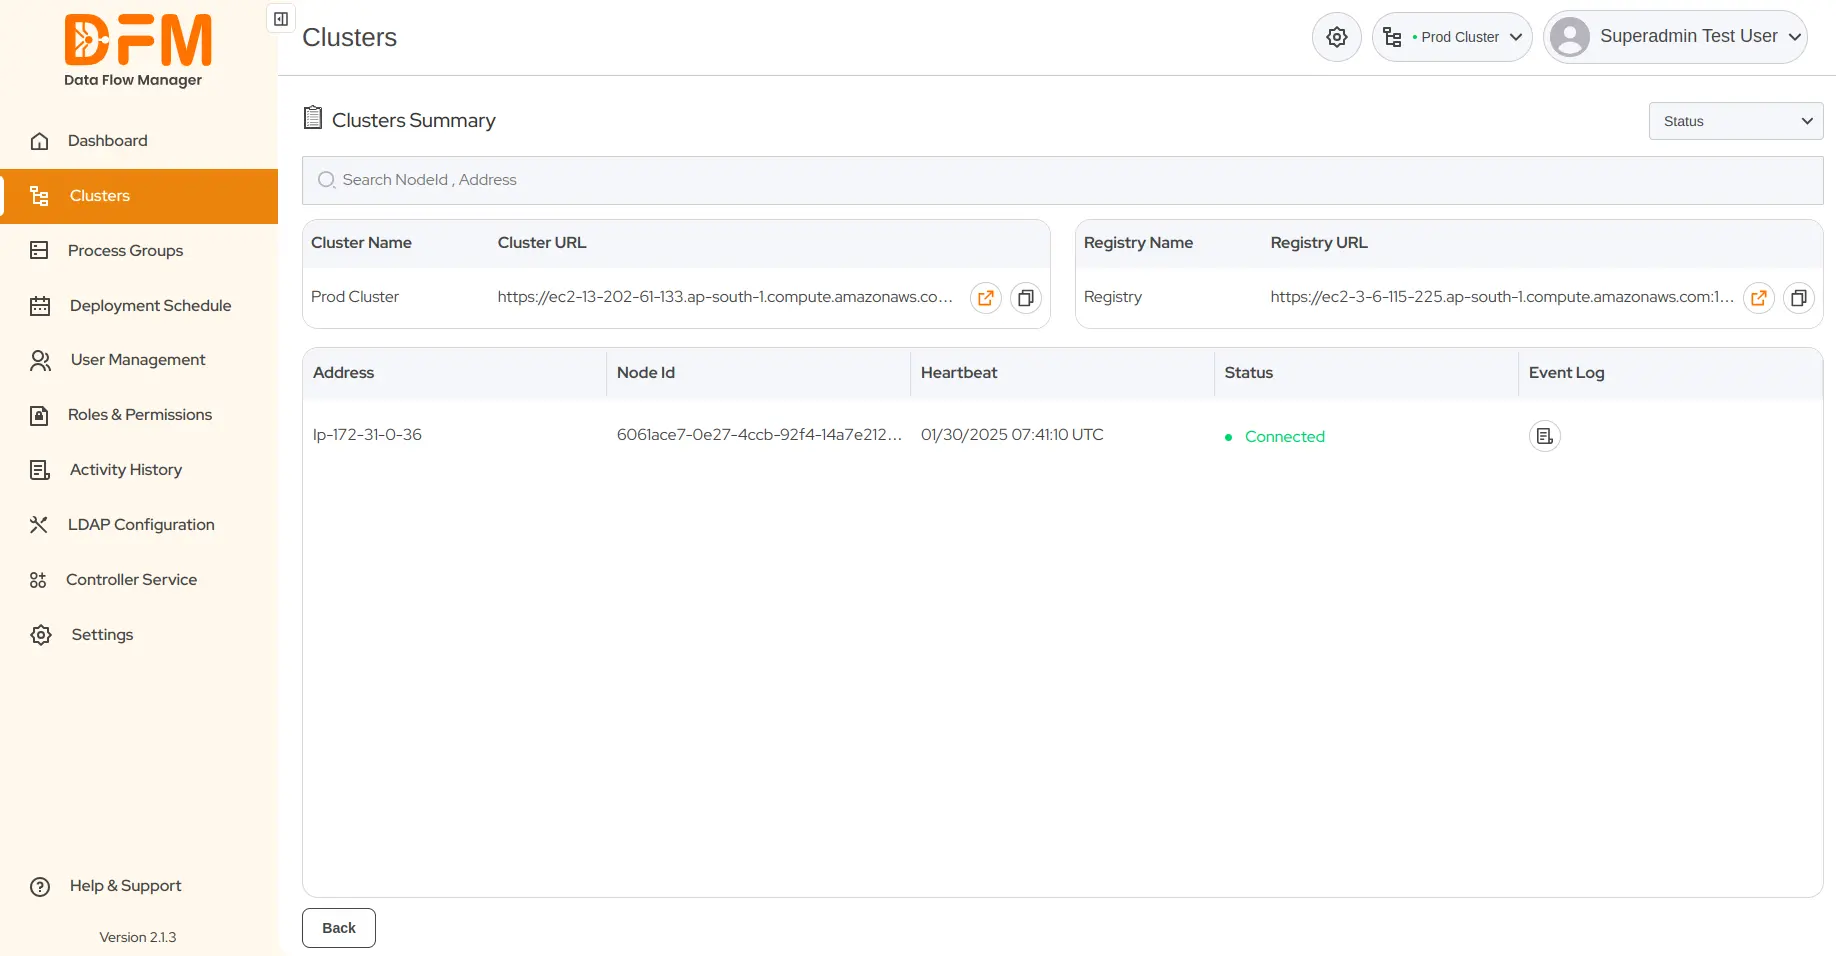
- To access the event log, click on the icon mentioned. You’ll get a list of node events with address and node ID.
To edit the cluster details:
- From the vertical ellipsis menu present on the right side of the cluster, click Edit.

- You can modify the cluster and registry details.
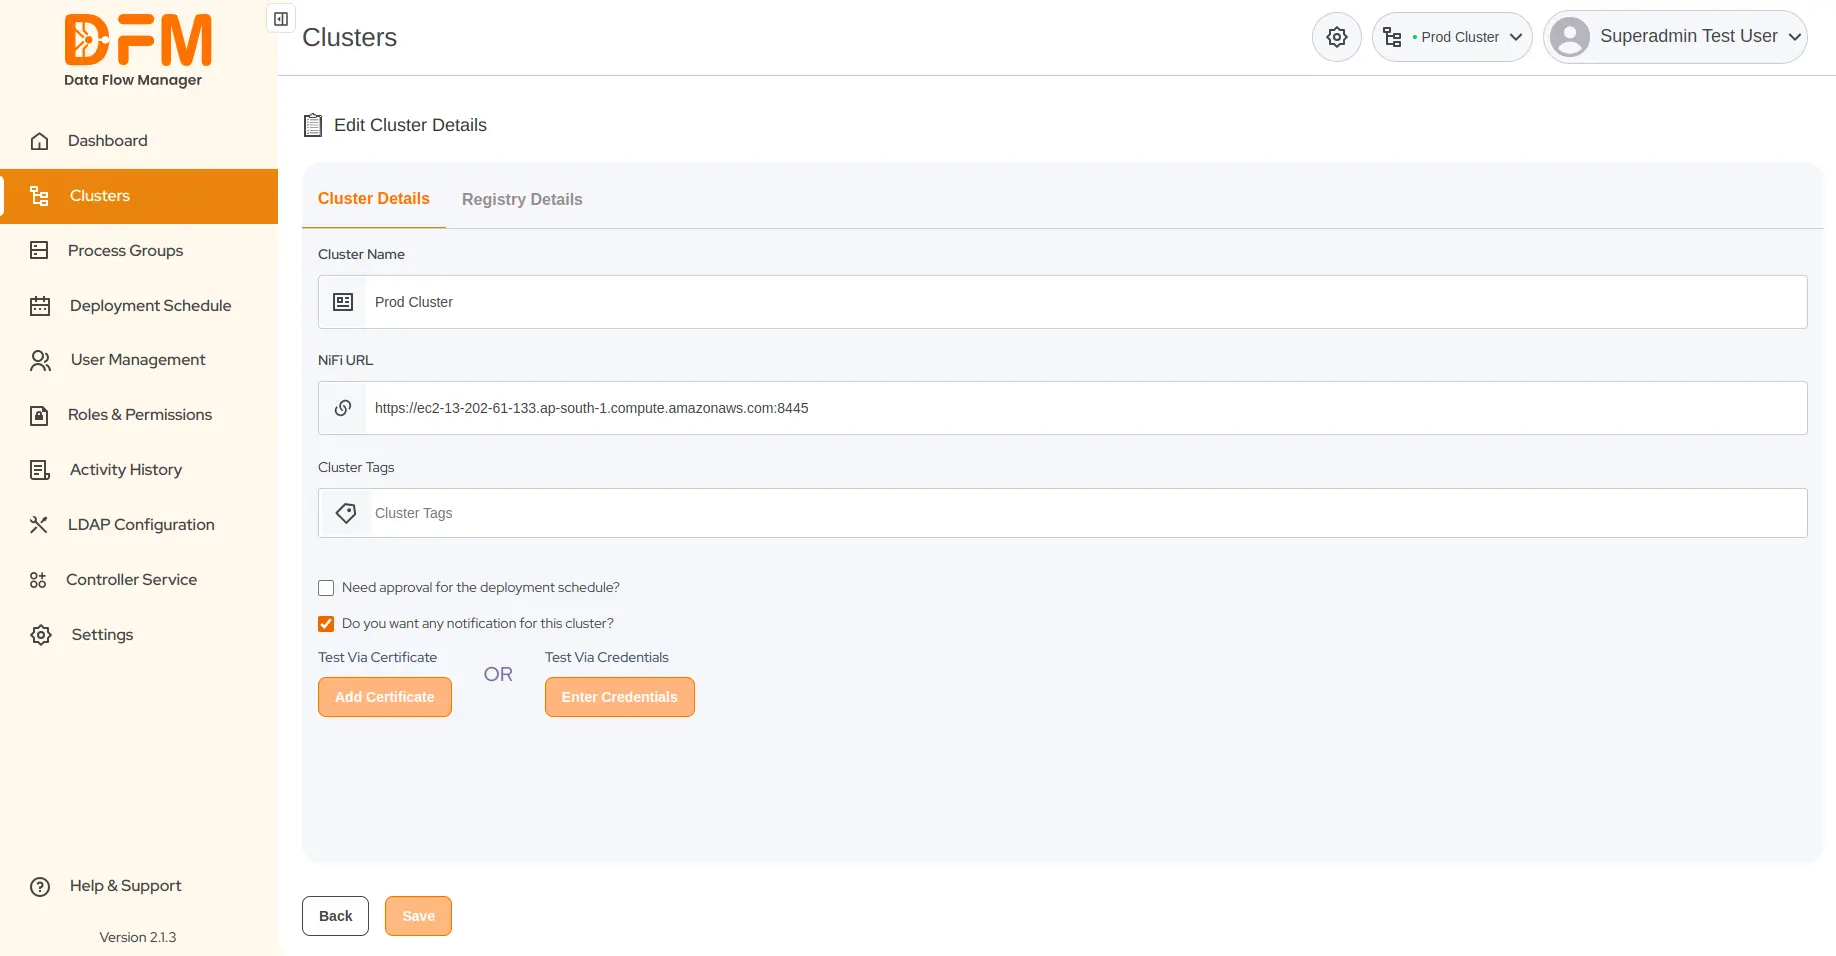
- Once done, click Save and continue.
To activate the cluster:
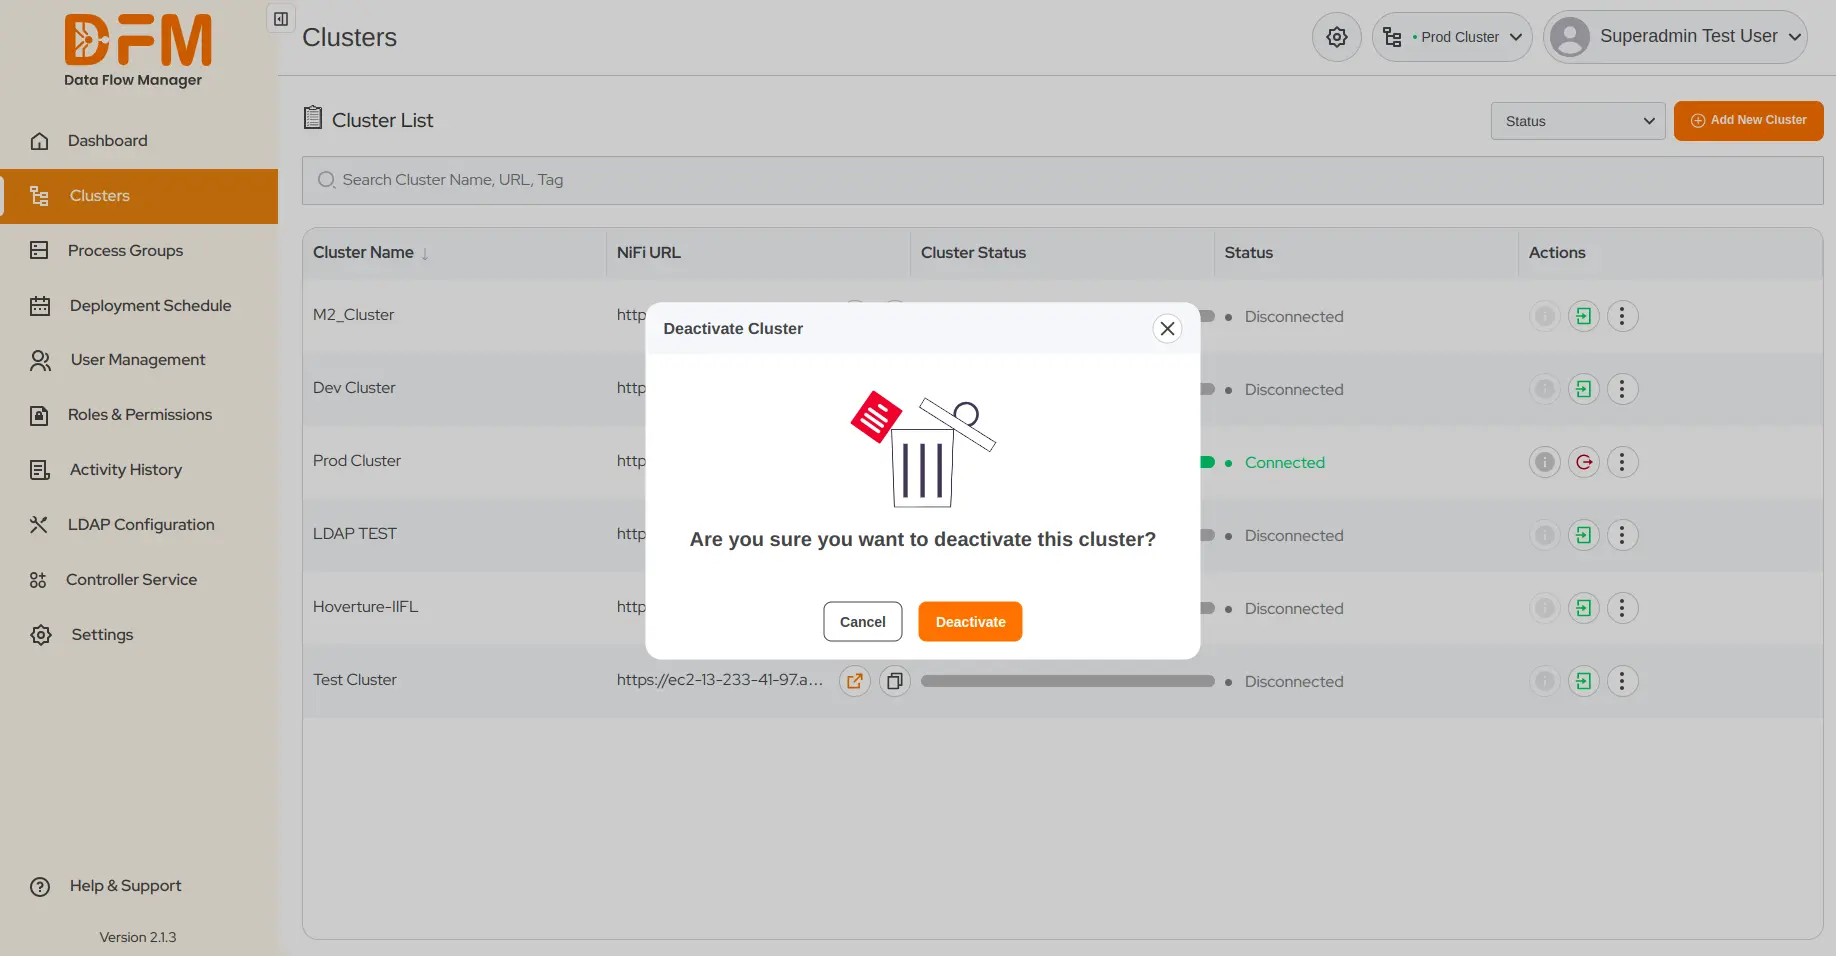
- Click on the vertical ellipsis menu of that cluster and choose Deactivate.

- Confirm whether you want to deactivate by clicking Deactivate.
3.4. How to add a new cluster?
You can add as many clusters as you want from your NiFi instance to Data Flow Manager. To add a new cluster:
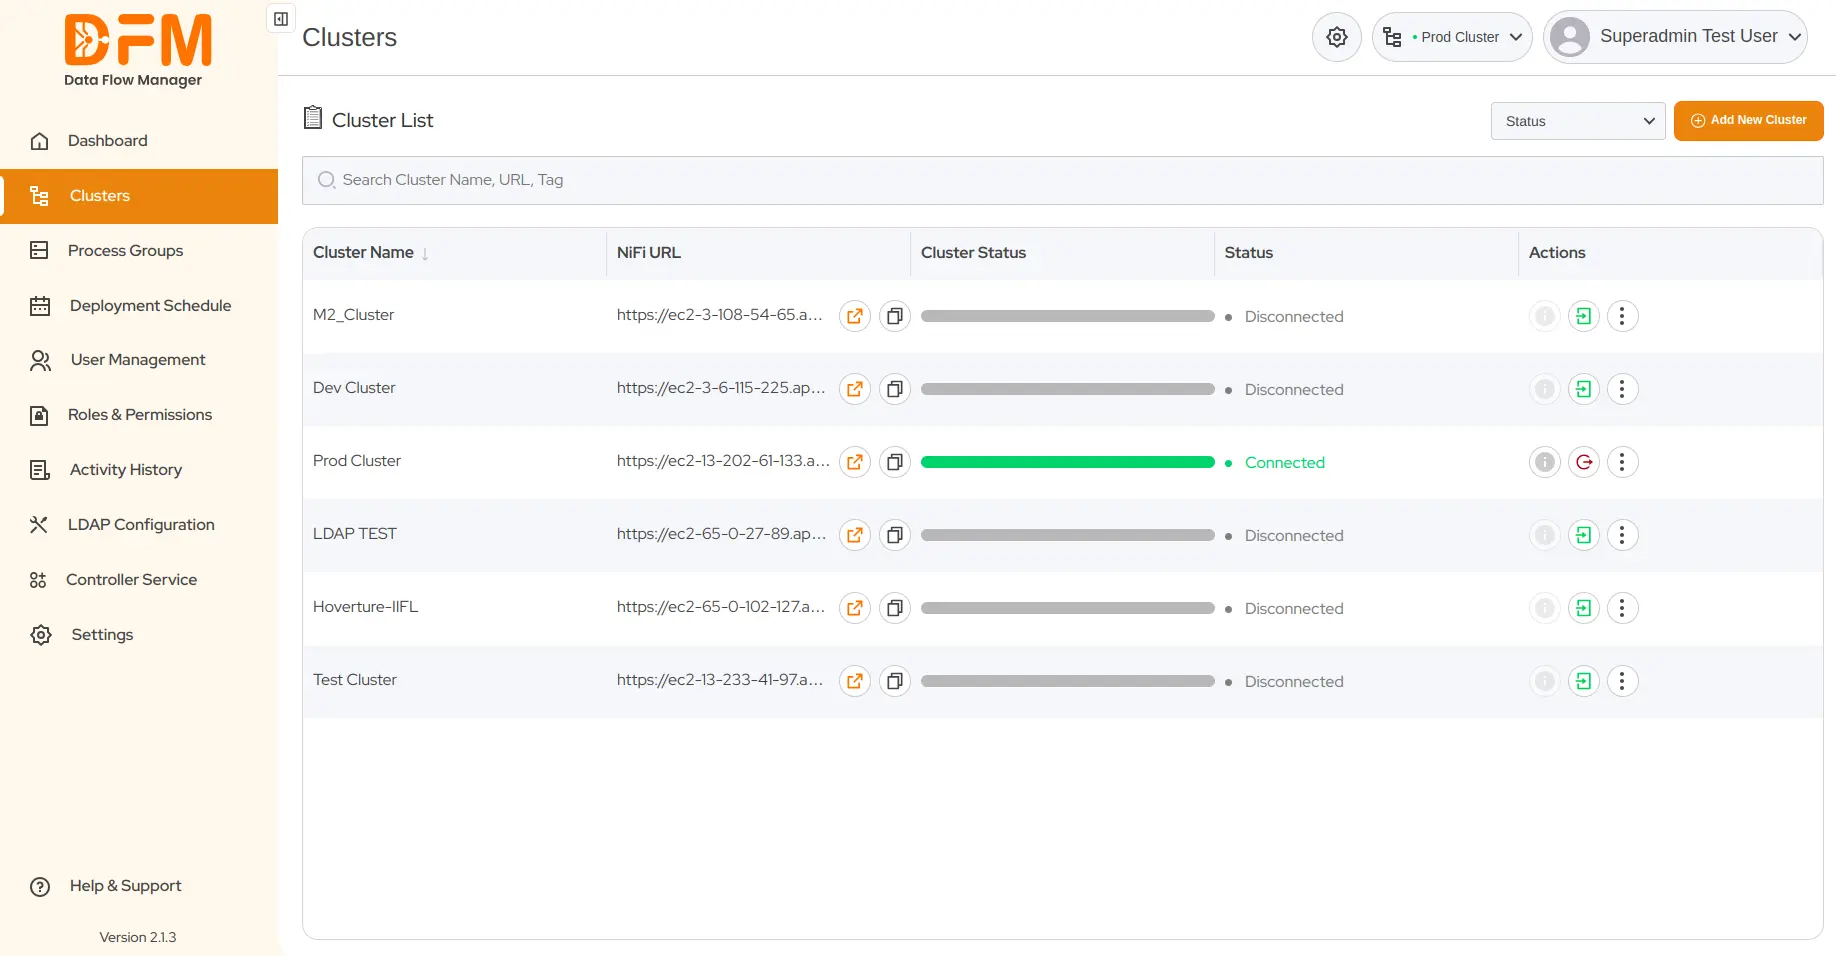
- Go to the Clusters tab.
- Click the button ‘Add New Cluster’ from the top-right corner.
-
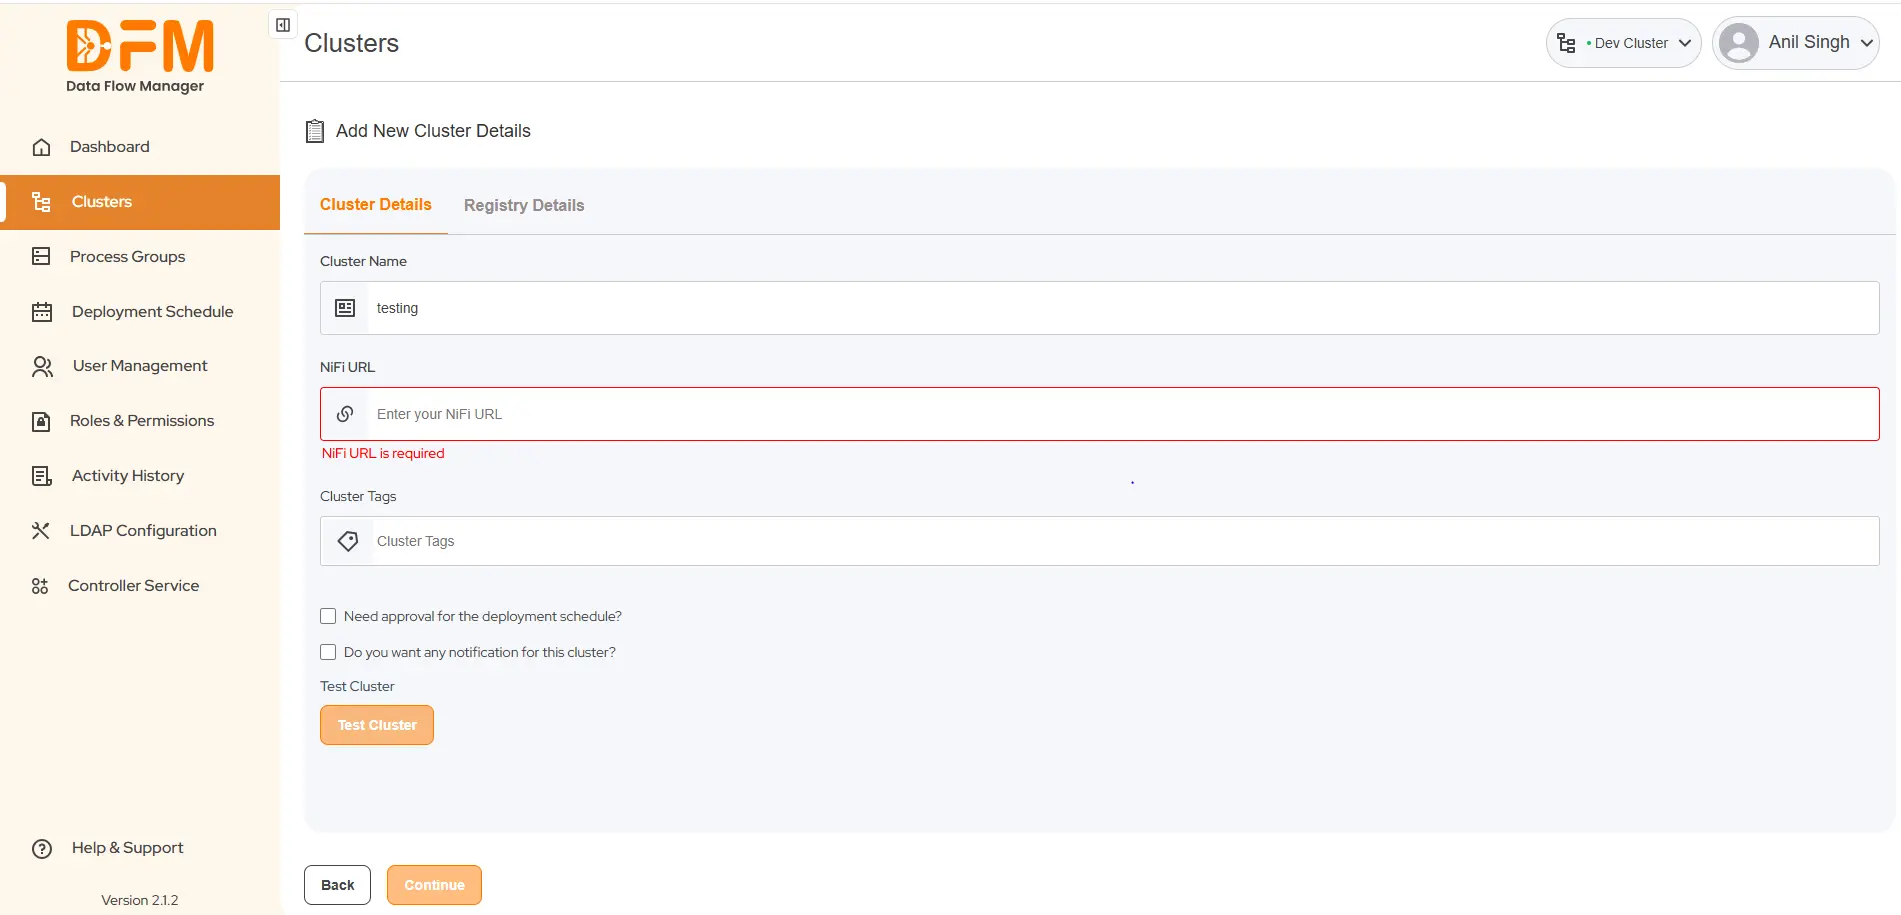
The first step is to enter the cluster details as follows:
- Cluster Name: Enter the name of the cluster in this Input field.
- NiFi URL: Enter the NiFi URL in this input field.
- Cluster Type: Add cluster tags.
- Checkbox for approval of scheduled deployment: This checkbox specifies if approval is required before the scheduled deployment is finalized. If selected, the scheduled deployment will not proceed until an authorized user approves it.
- Checkbox to receive notifications for the cluster: This checkbox allows you to opt in to receive notifications related to the cluster you are onboarding. This could include alerts, status updates, and other relevant information about the cluster's operation. Enable this checkbox to receive cluster notifications; leave it unchecked to opt-out.
- Add Certificate: You can test the cluster by adding certificates or credentials.
- After validation, your cluster is added to the system. The successful onboarding of the cluster displays a confirmation dialog or success message.
- Click on "Continue" to proceed with registry details.
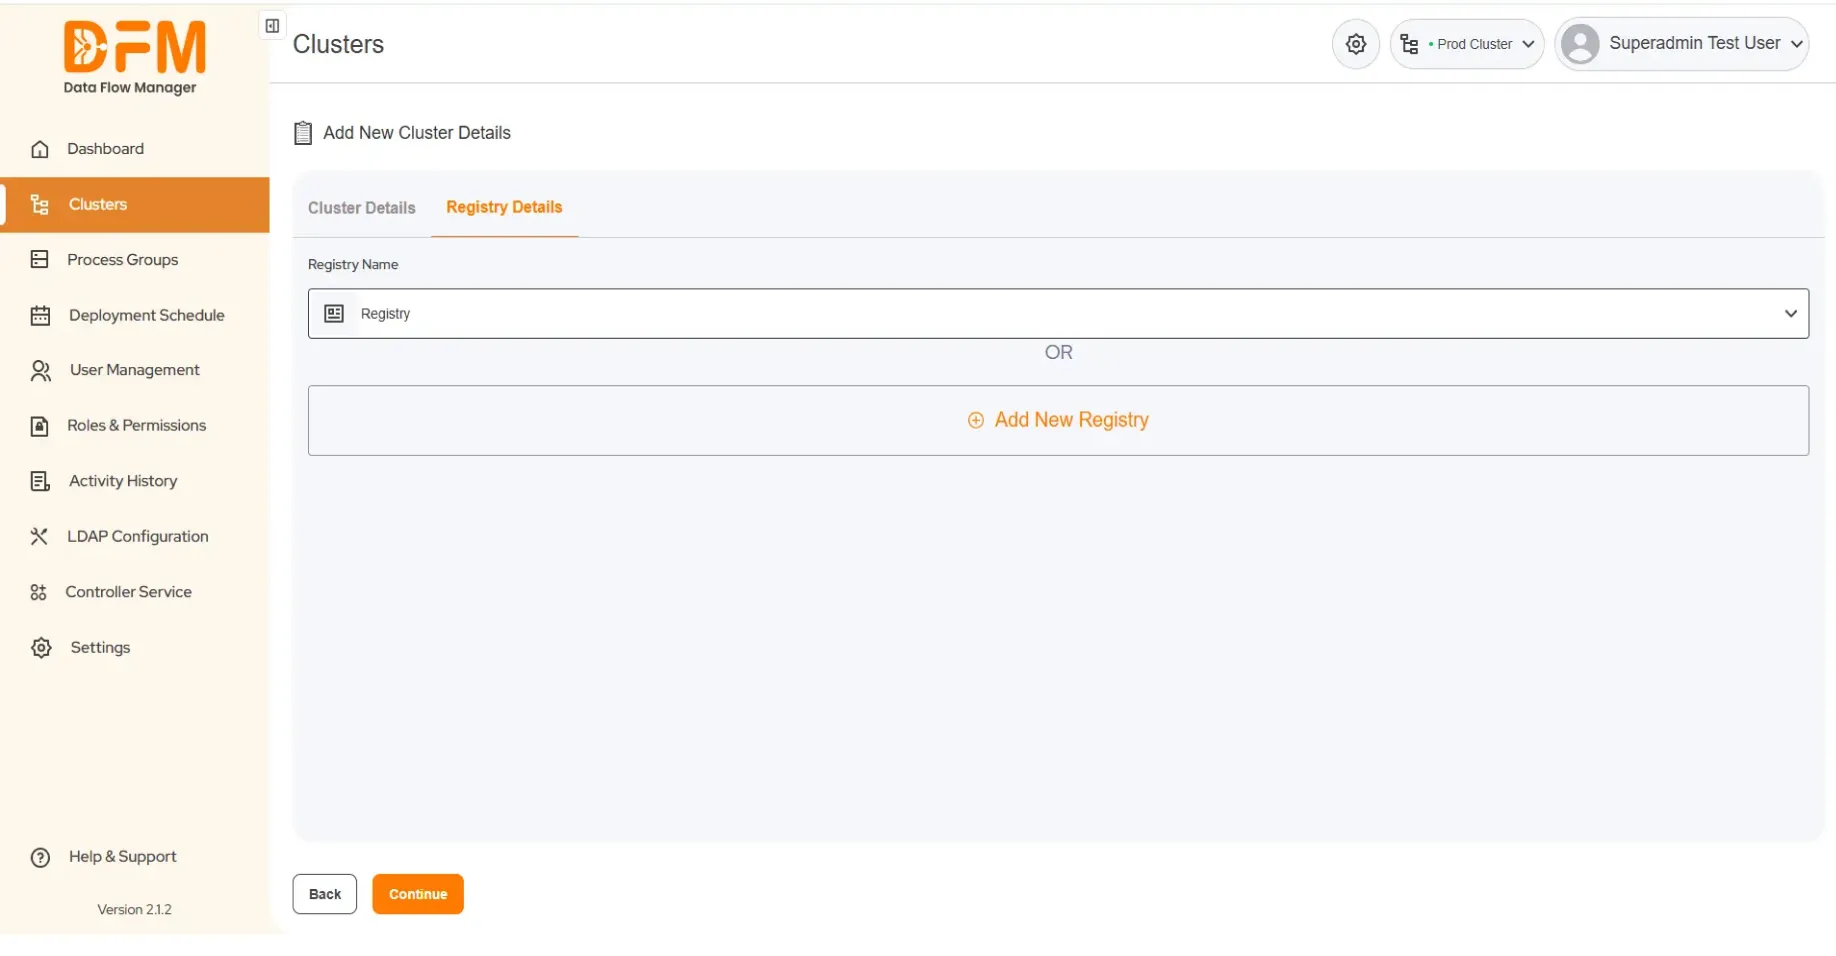
- You can either select an existing registry or add a new registry. Once you’ve entered the required information, click on Save to save the cluster details.
Note: You can easily edit the cluster and registry details even after onboarding it to Data Flow Manager.
3.5. How to log out of a cluster?
Logging out of a cluster is as simple as logging in.
- Go to the Clusters tab.
- Navigate to the cluster from which you want to log off.
- Under the Actions column, click the second icon with a red color to log out from the cluster.
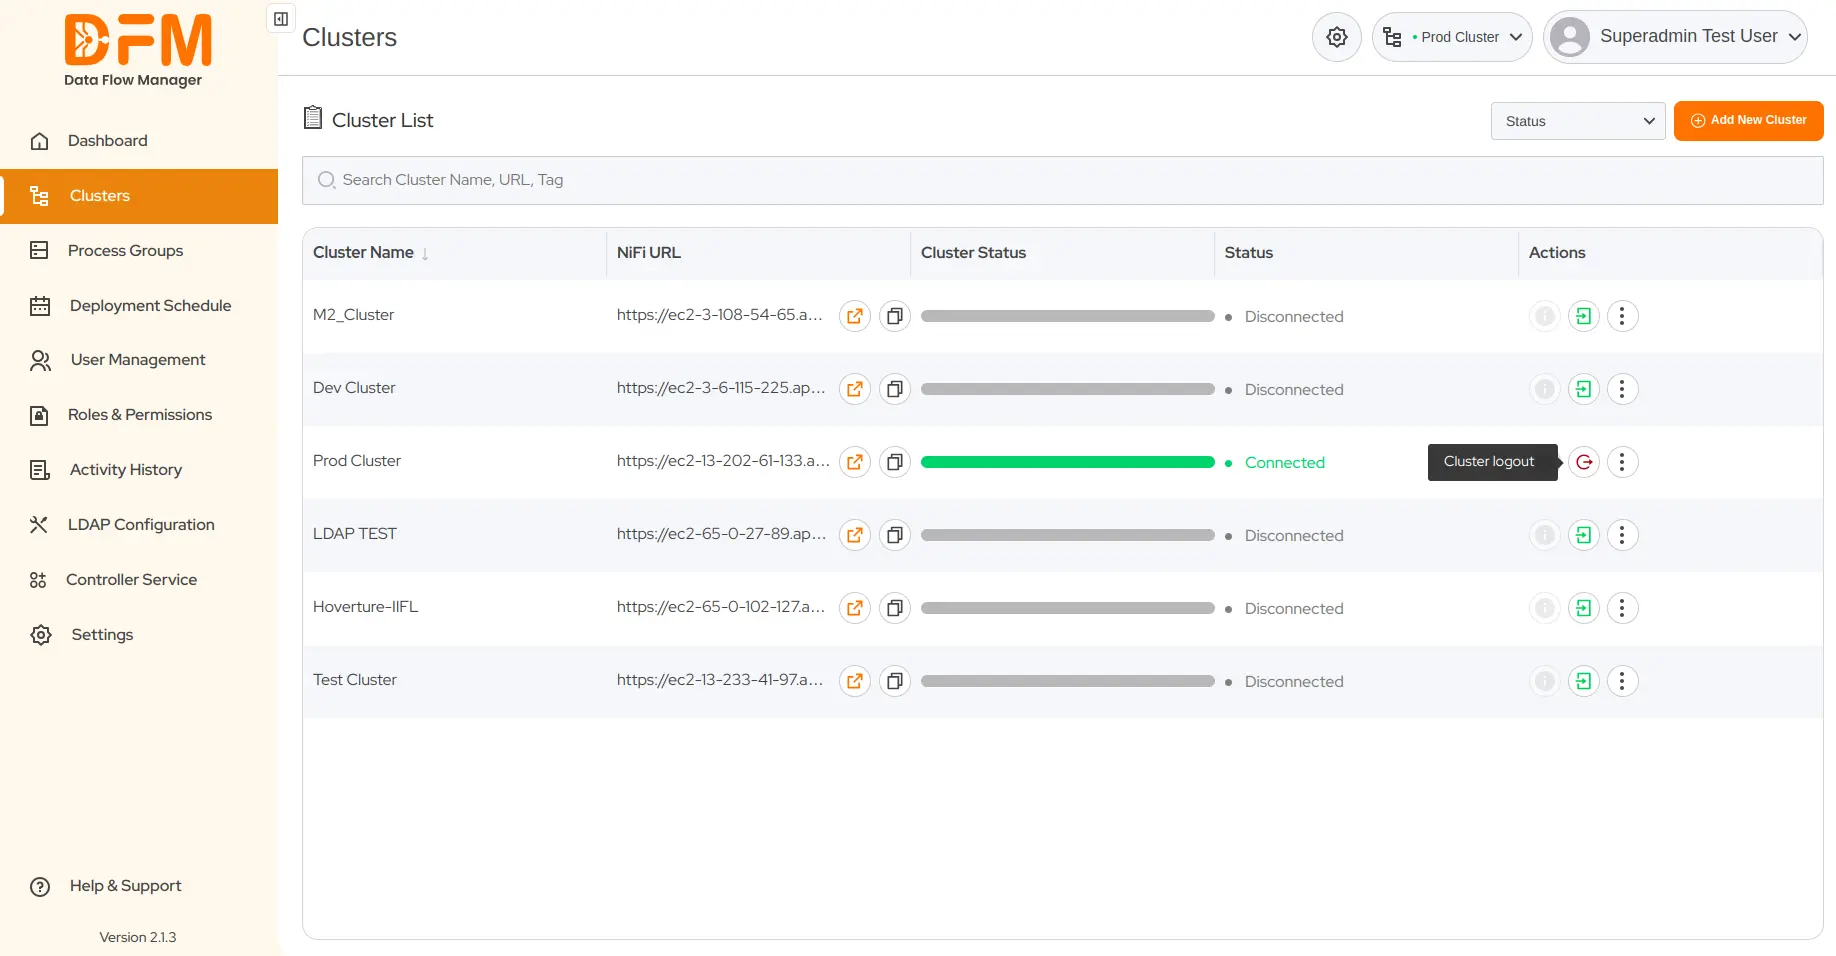
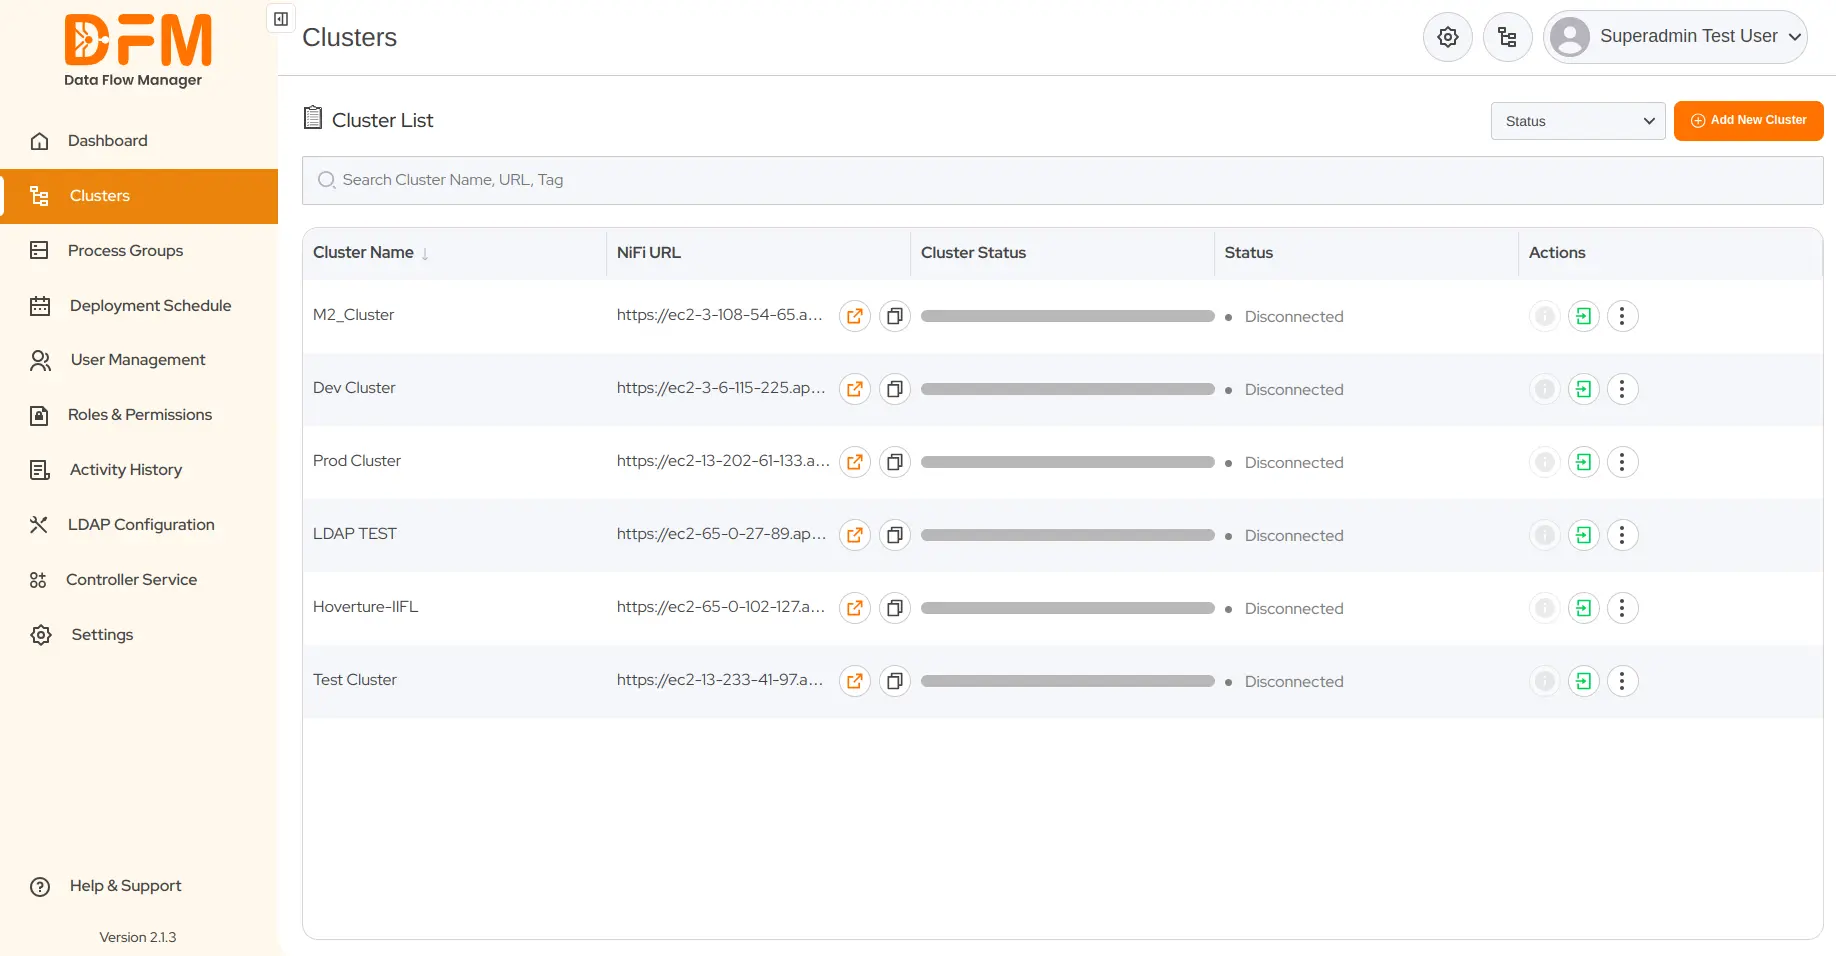
- Once you click it, you get a message displaying “Your cluster is now disconnected”.
3.6. Use filters to sort the cluster list
It becomes overwhelming to find a particular cluster from a list of many. You can filter this list based on the cluster status - Connected/Disconnected and Deactivate.
To filter the cluster list,
- Go to the dropdown with the name Status in the top-right corner.
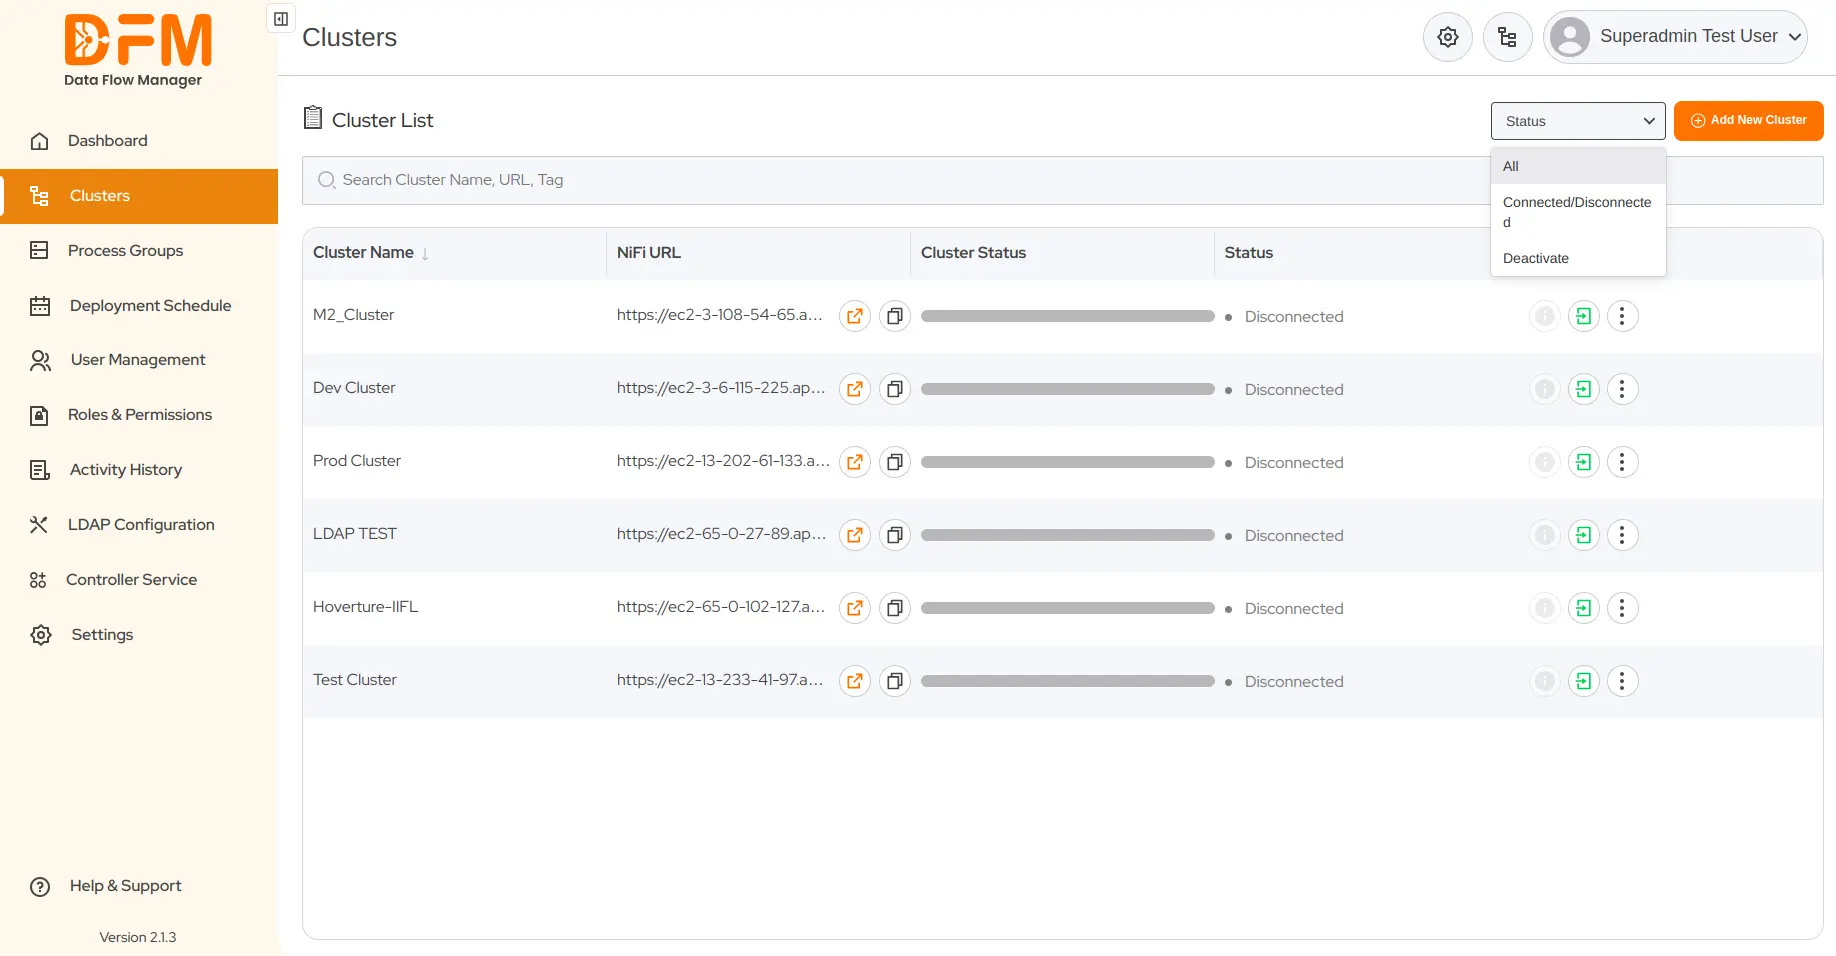
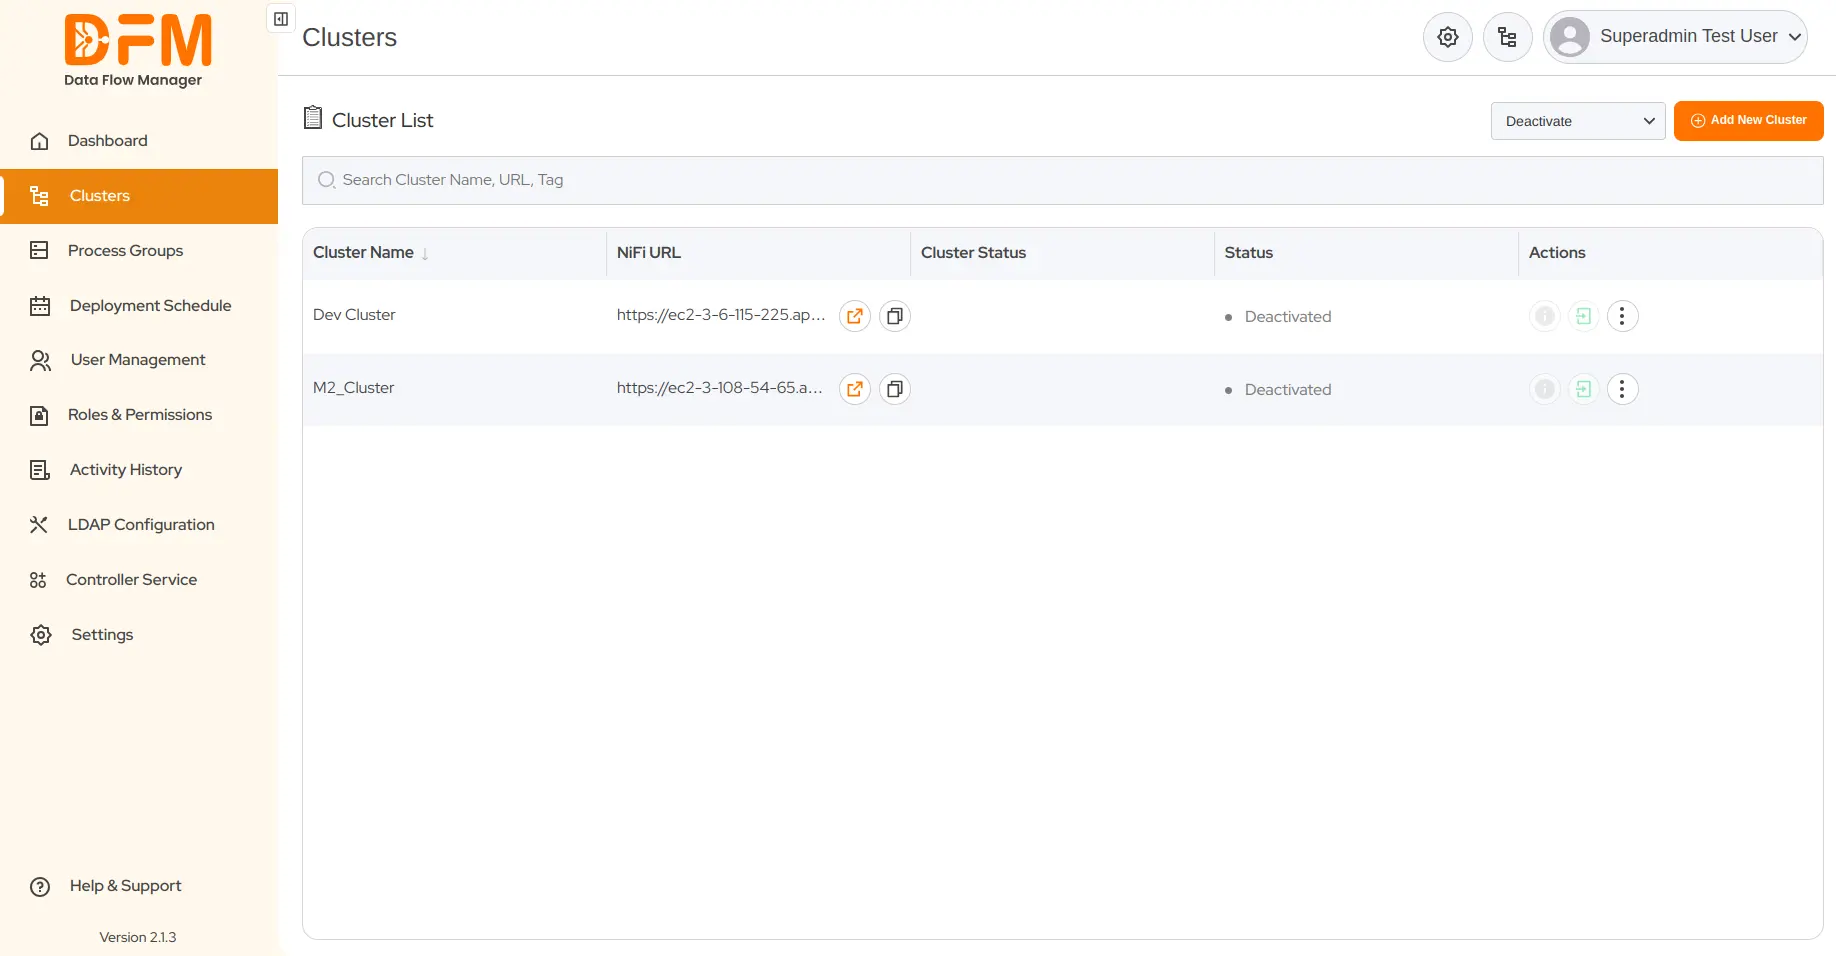
- Choose the status so that the list contains the clusters accordingly. If you choose Deactivated, the list will contain only deactivated clusters.
4. Process Groups
The Process Groups tab lists all process groups in clusters you are currently logged in to. With the point-and-click interface, you can easily deploy & upgrade your process groups instantly or schedule them in advance. This is possible only for users with write access to the Process Groups tab.
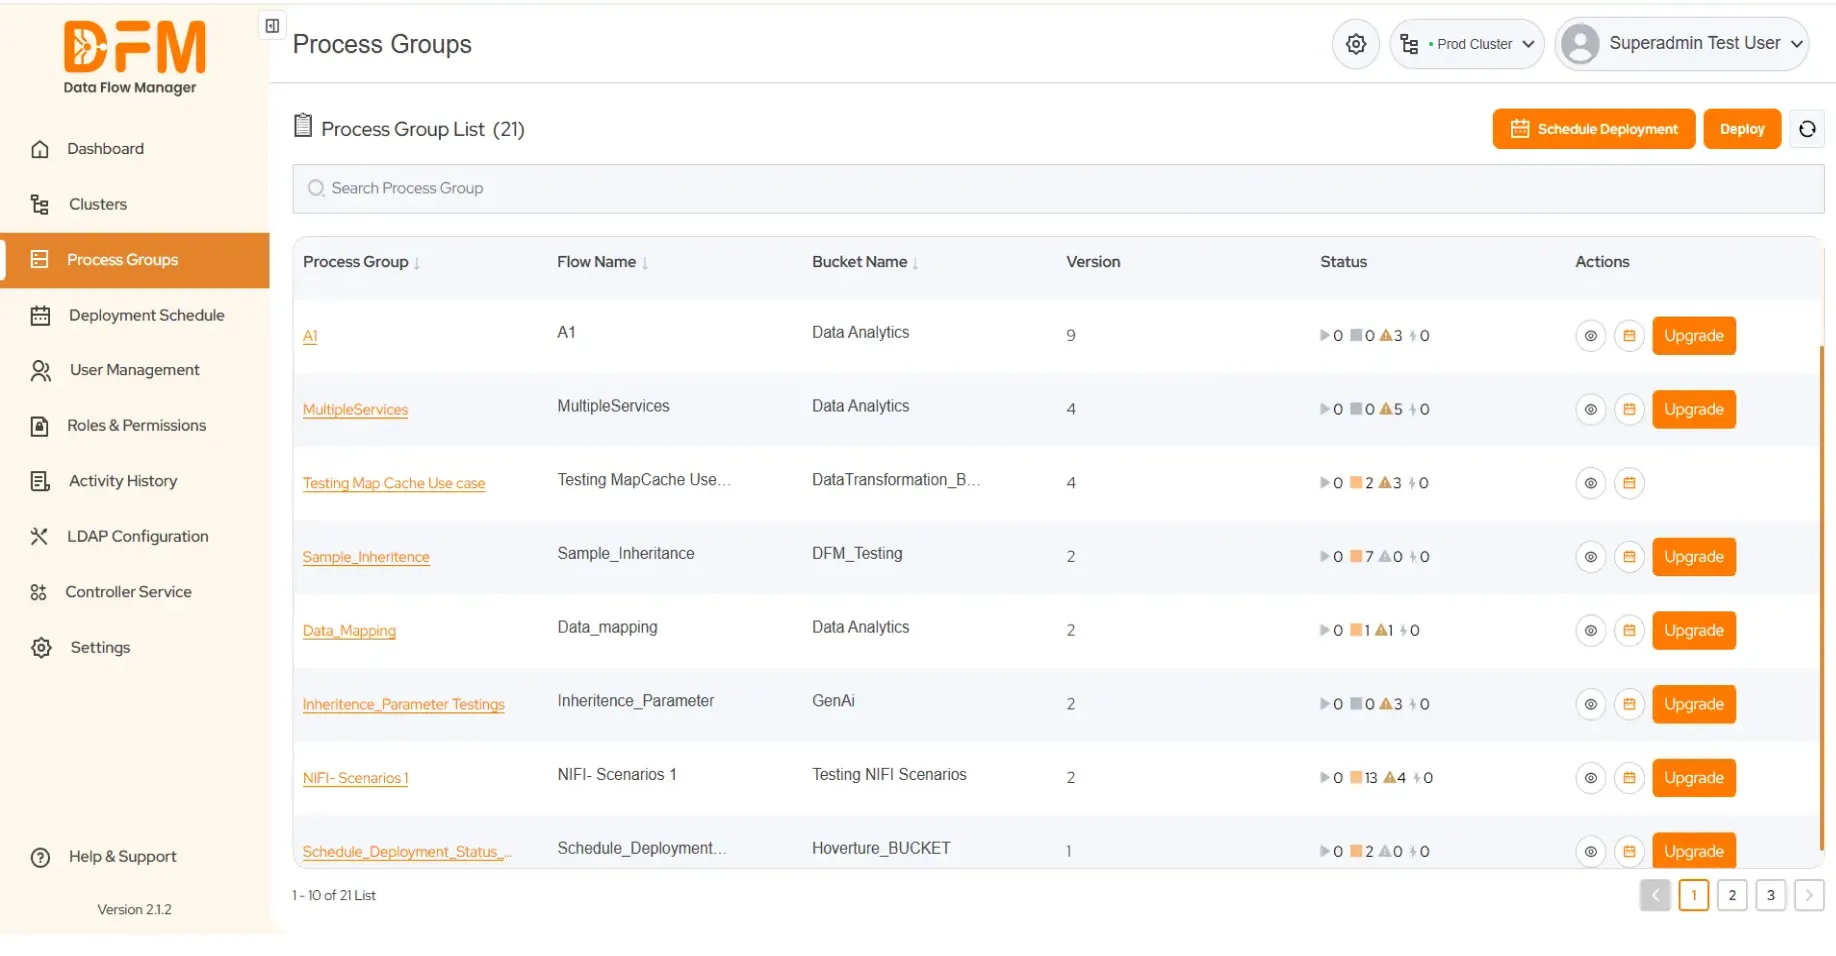
In addition, you can access the details of each process group, edit parameter contexts and variables, and configure controller services.
4.1. View process group details
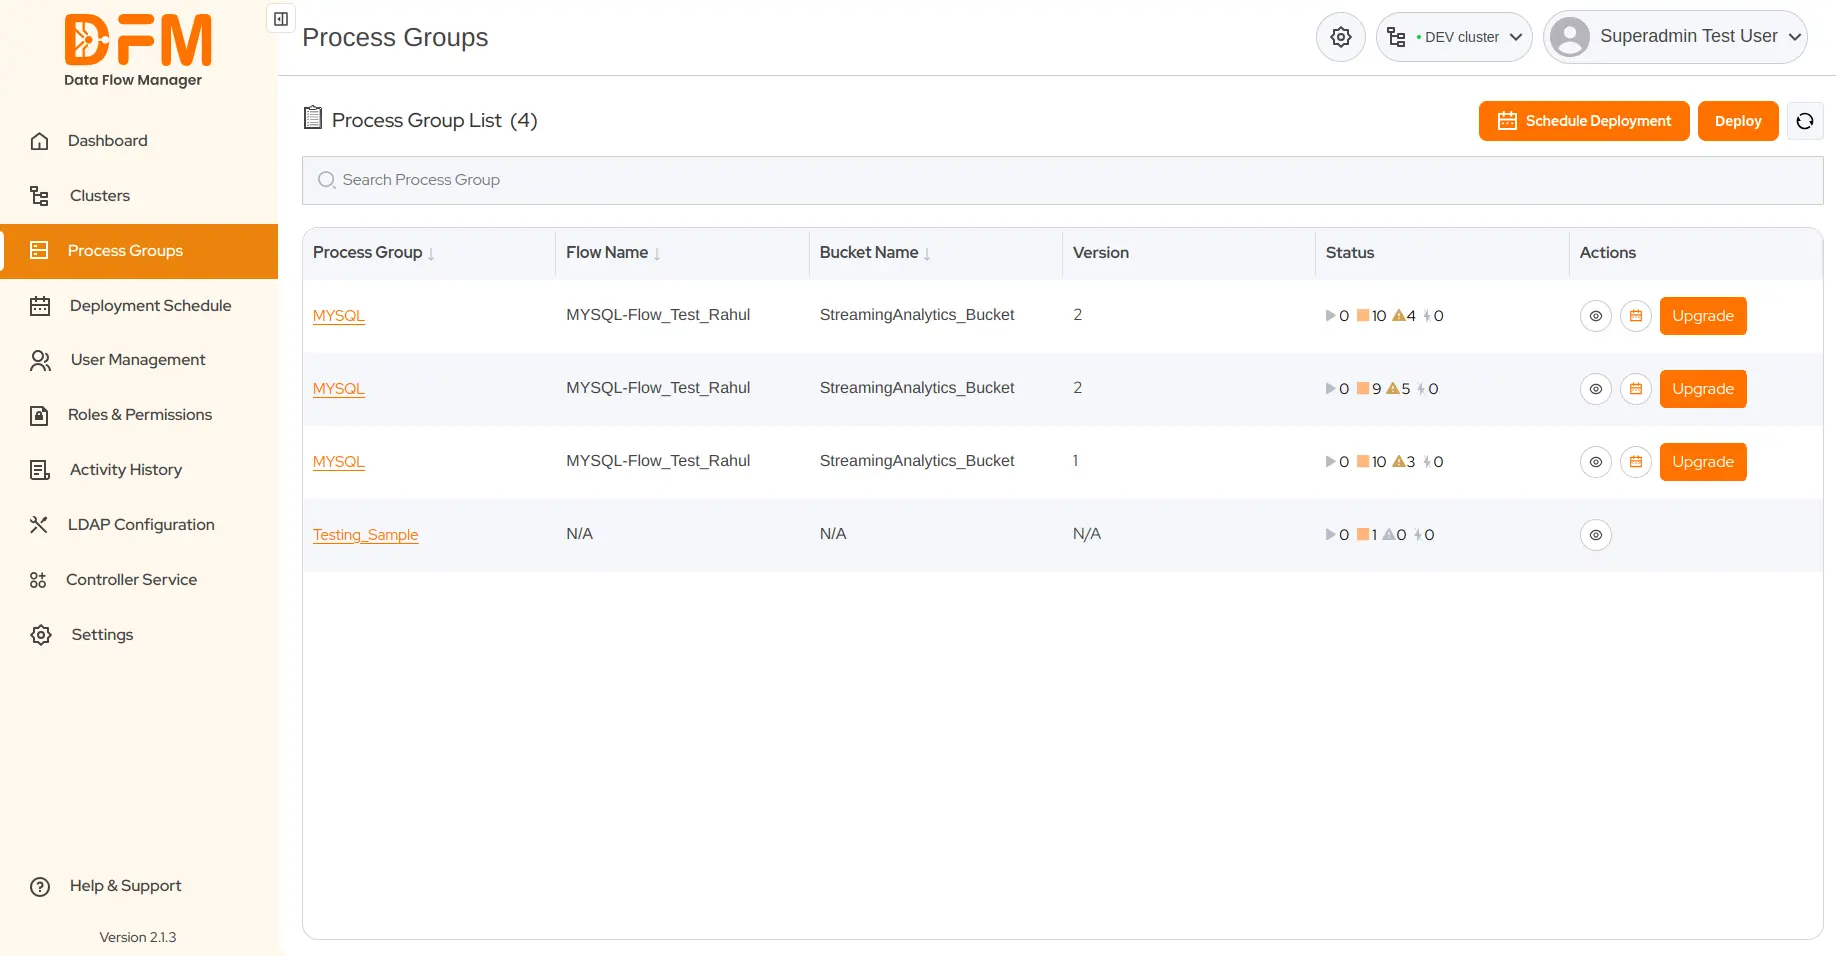
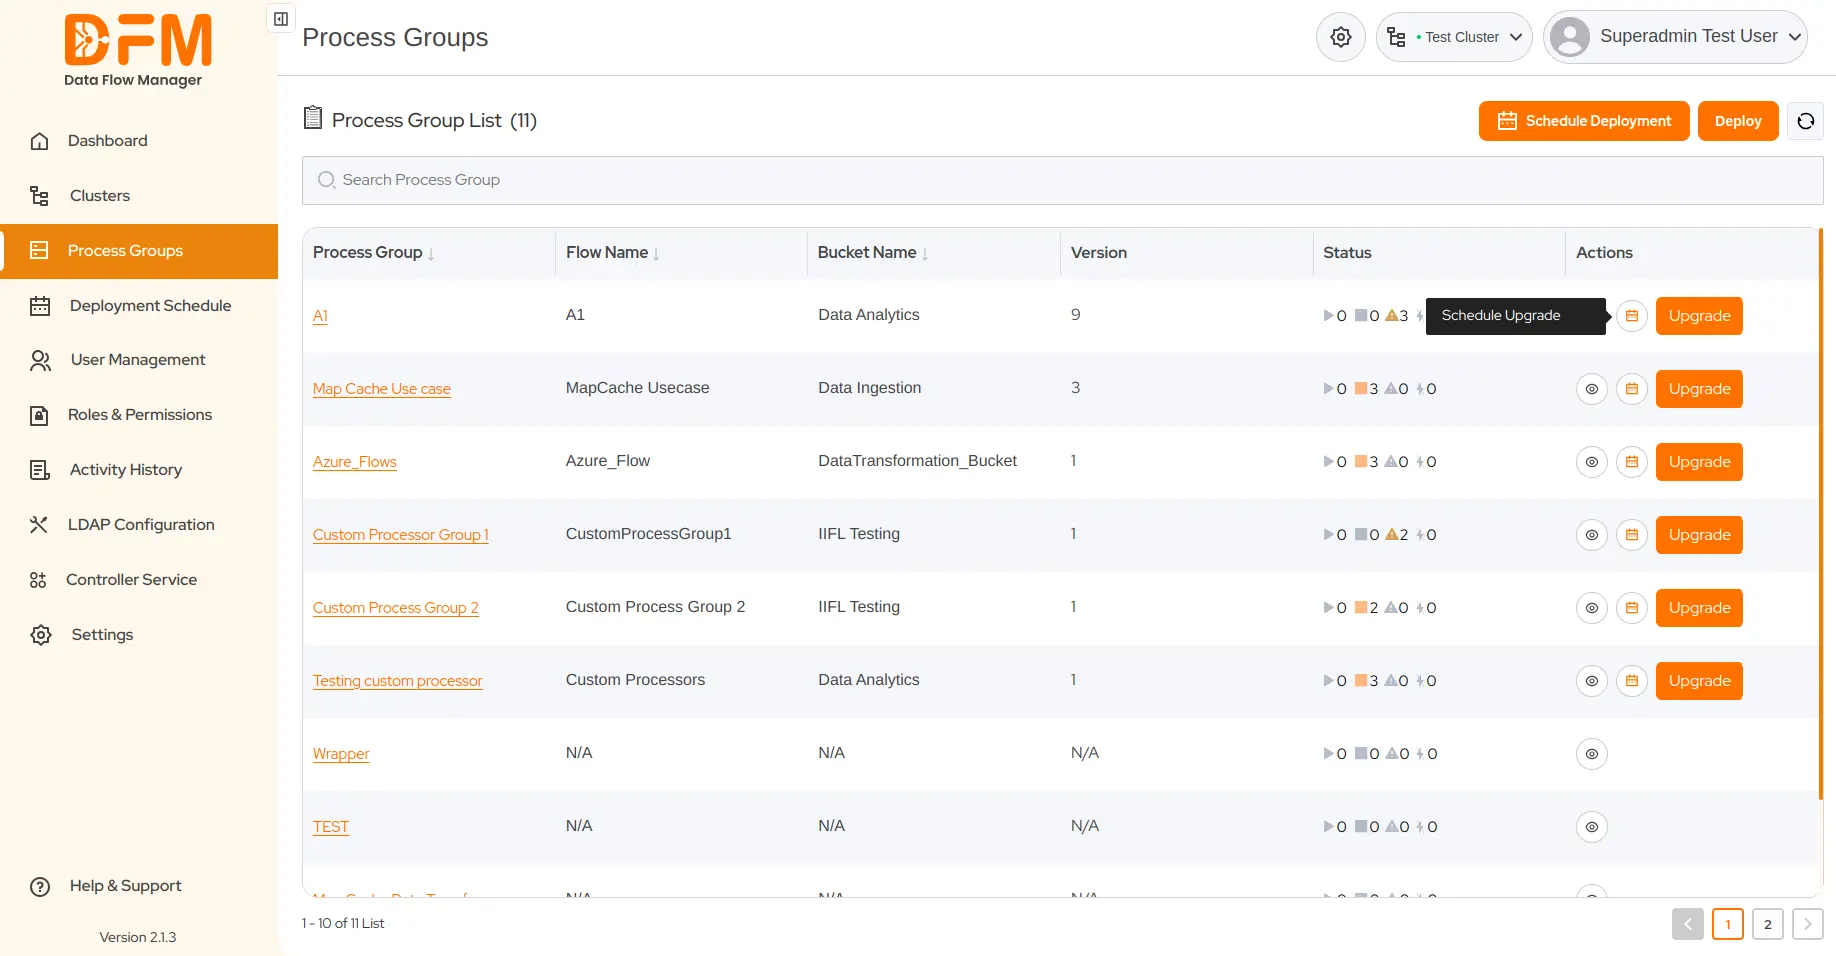
Each process group is listed with the flow name, bucket name, version, status, and actions to view details and upgrade the process group instantly and in advance.
The status column displays 4 major parameters of the process group - running flows, stopped flows, invalid flows, and disabled flows – providing real-time visibility into flow states.
To view the details of a specific process group,
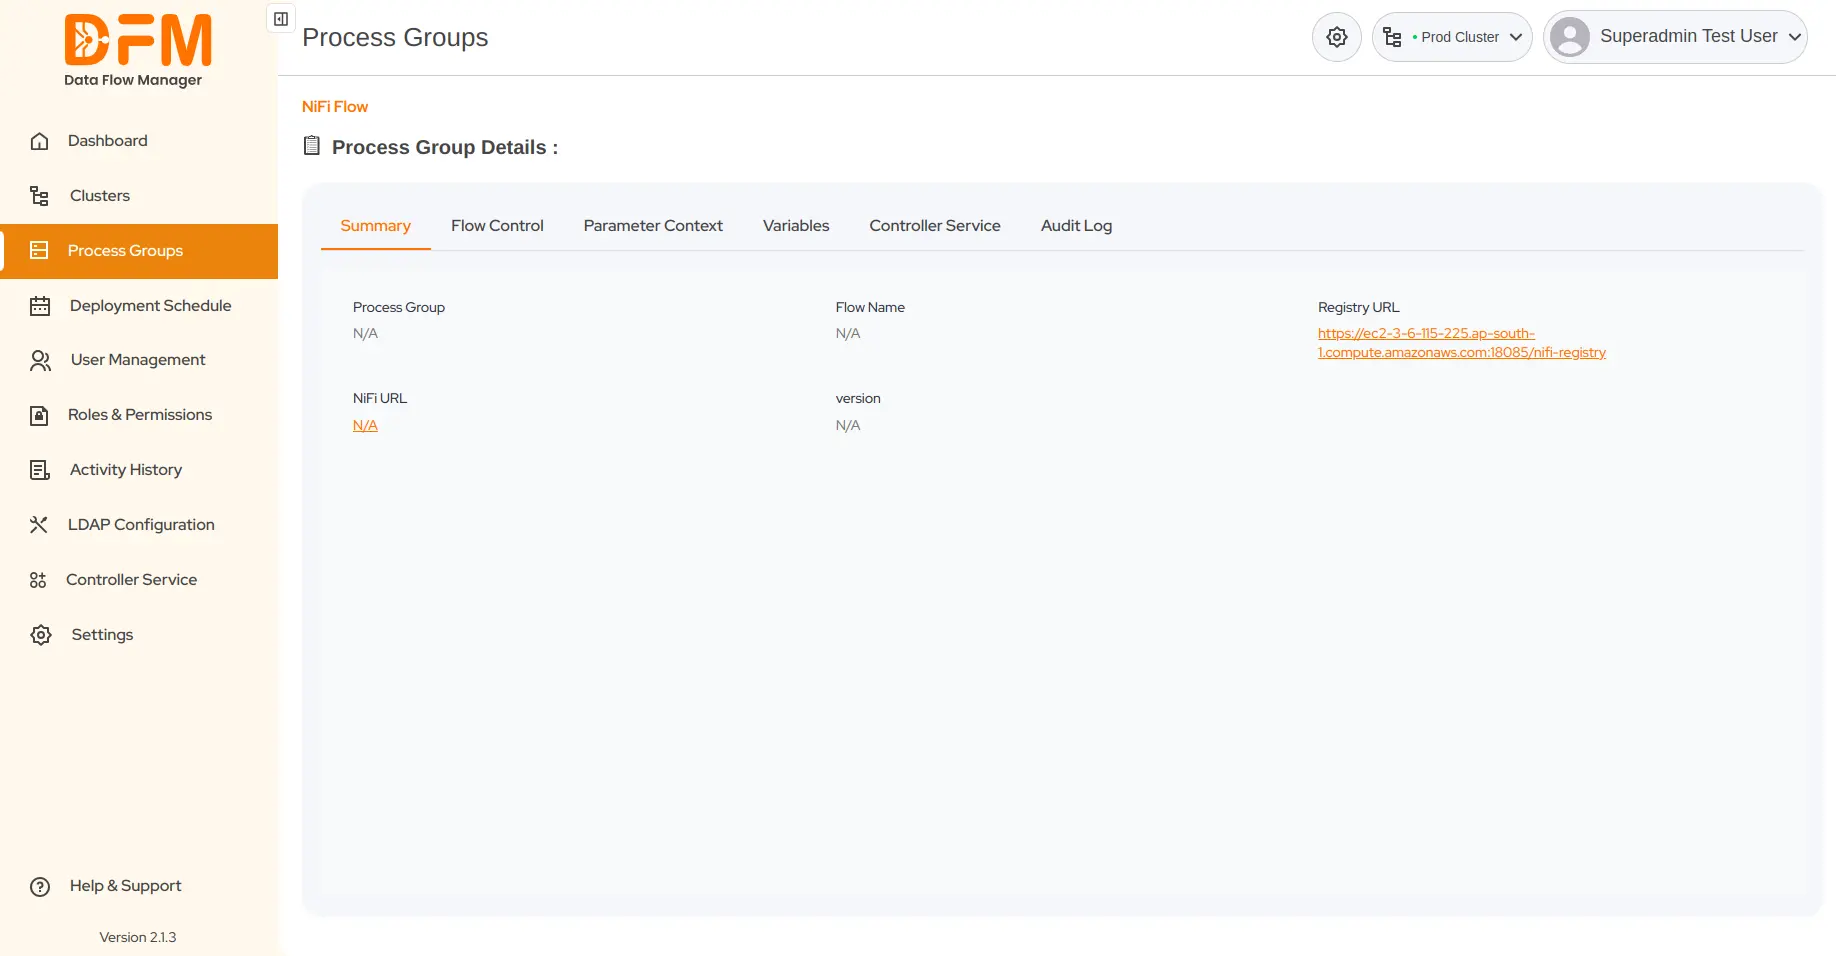
- Under the Actions column, click the eye icon.
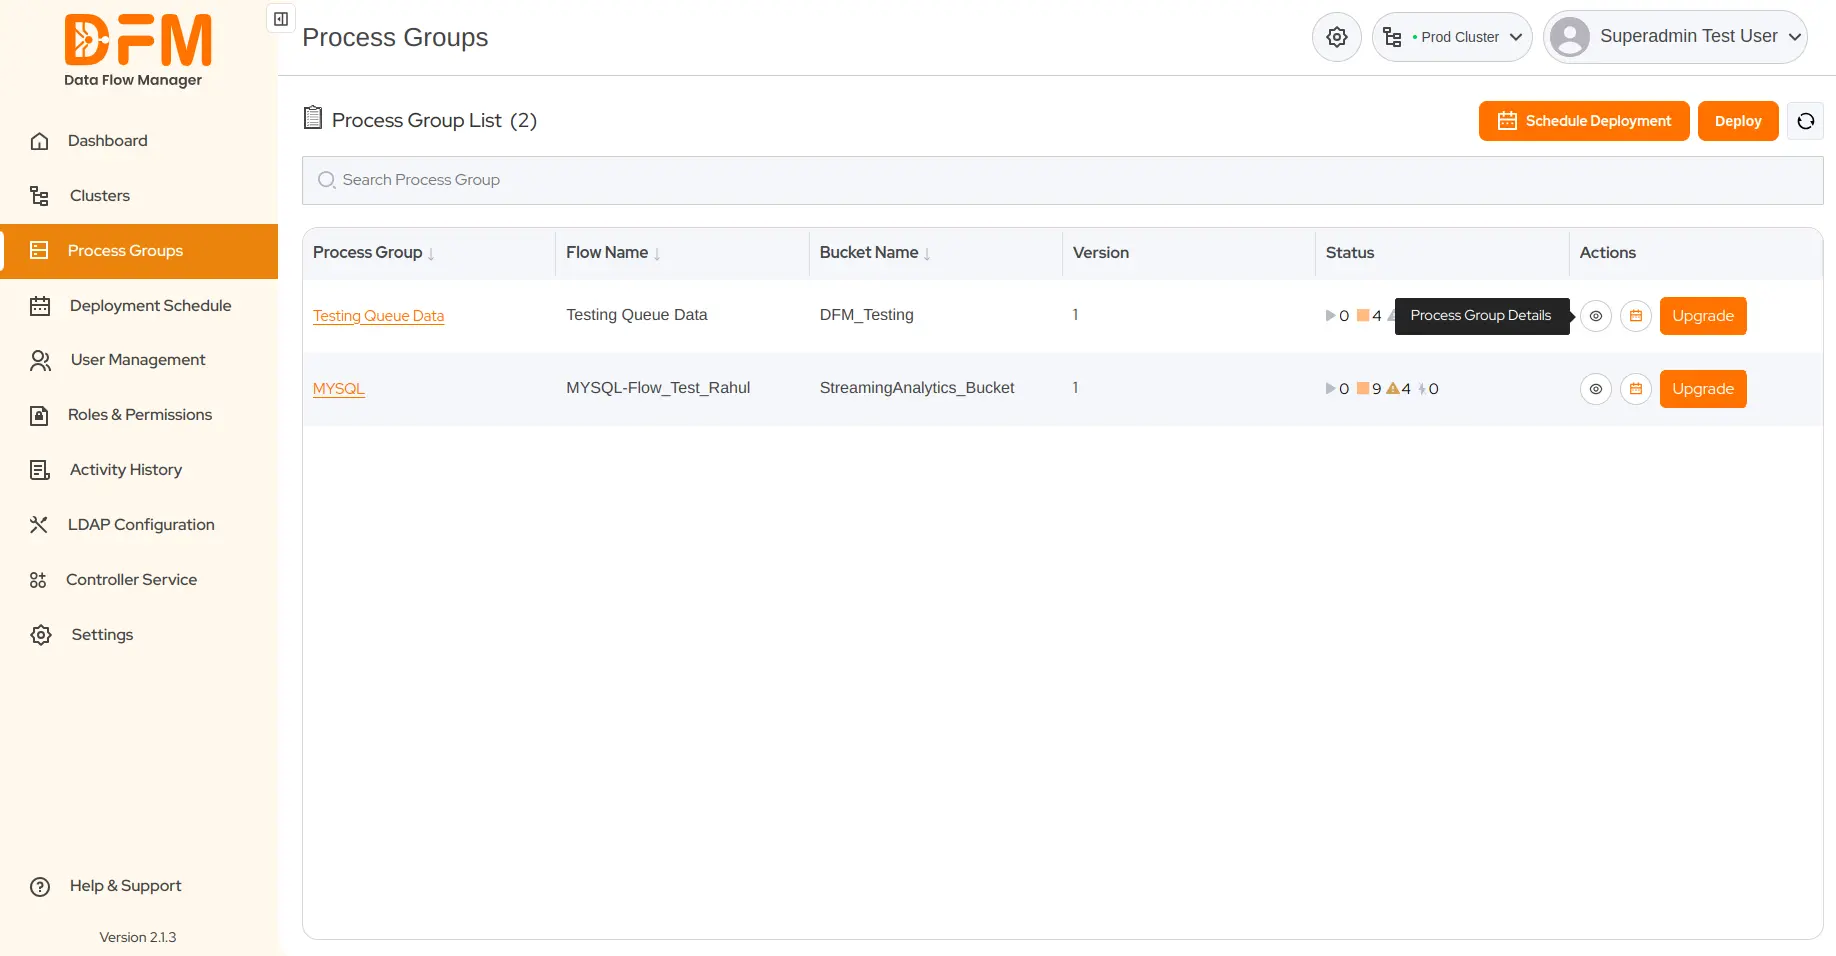
- You’ll get all the details of the process group, such as summary, flow control, parameter context, variables, controller service, and audit log.
4.2. How to deploy a process group?
To deploy a process group:
- Click the Deploy button on the top-right corner.
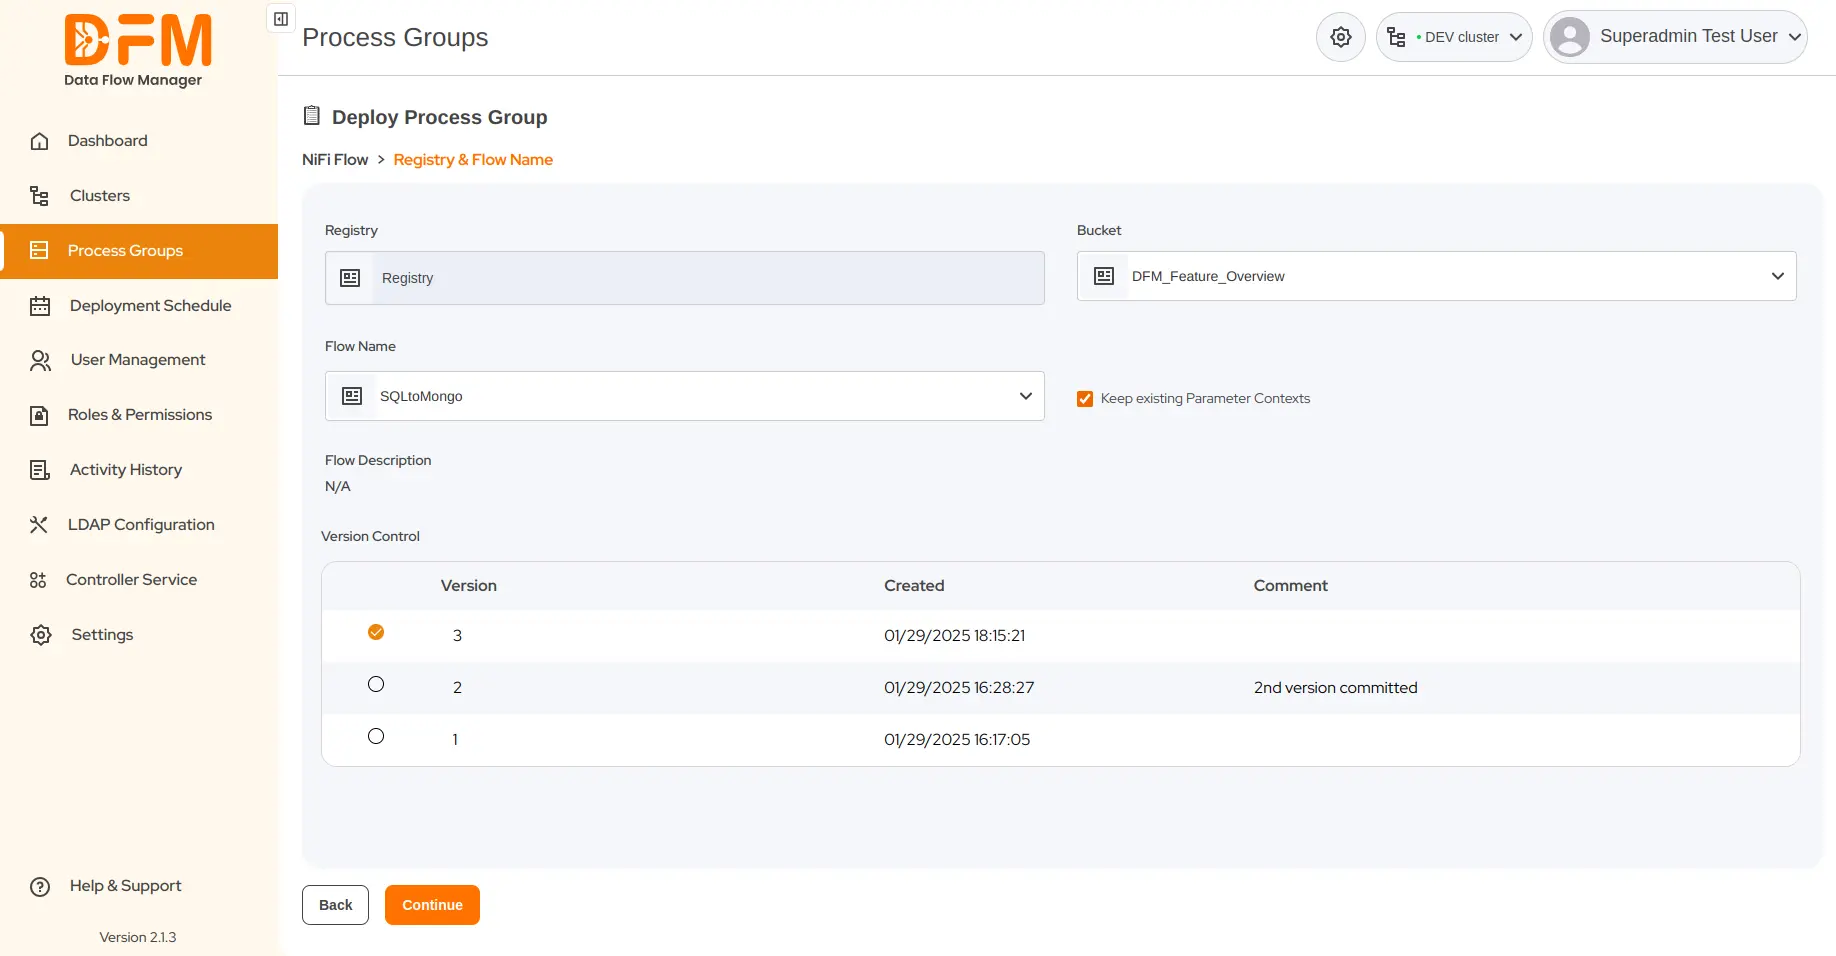
- Select Bucket and Flow Name.
- Mark the checkbox to keep existing parameter contexts. Otherwise, unmark it.
- Select the flow version you want to deploy and click Continue.
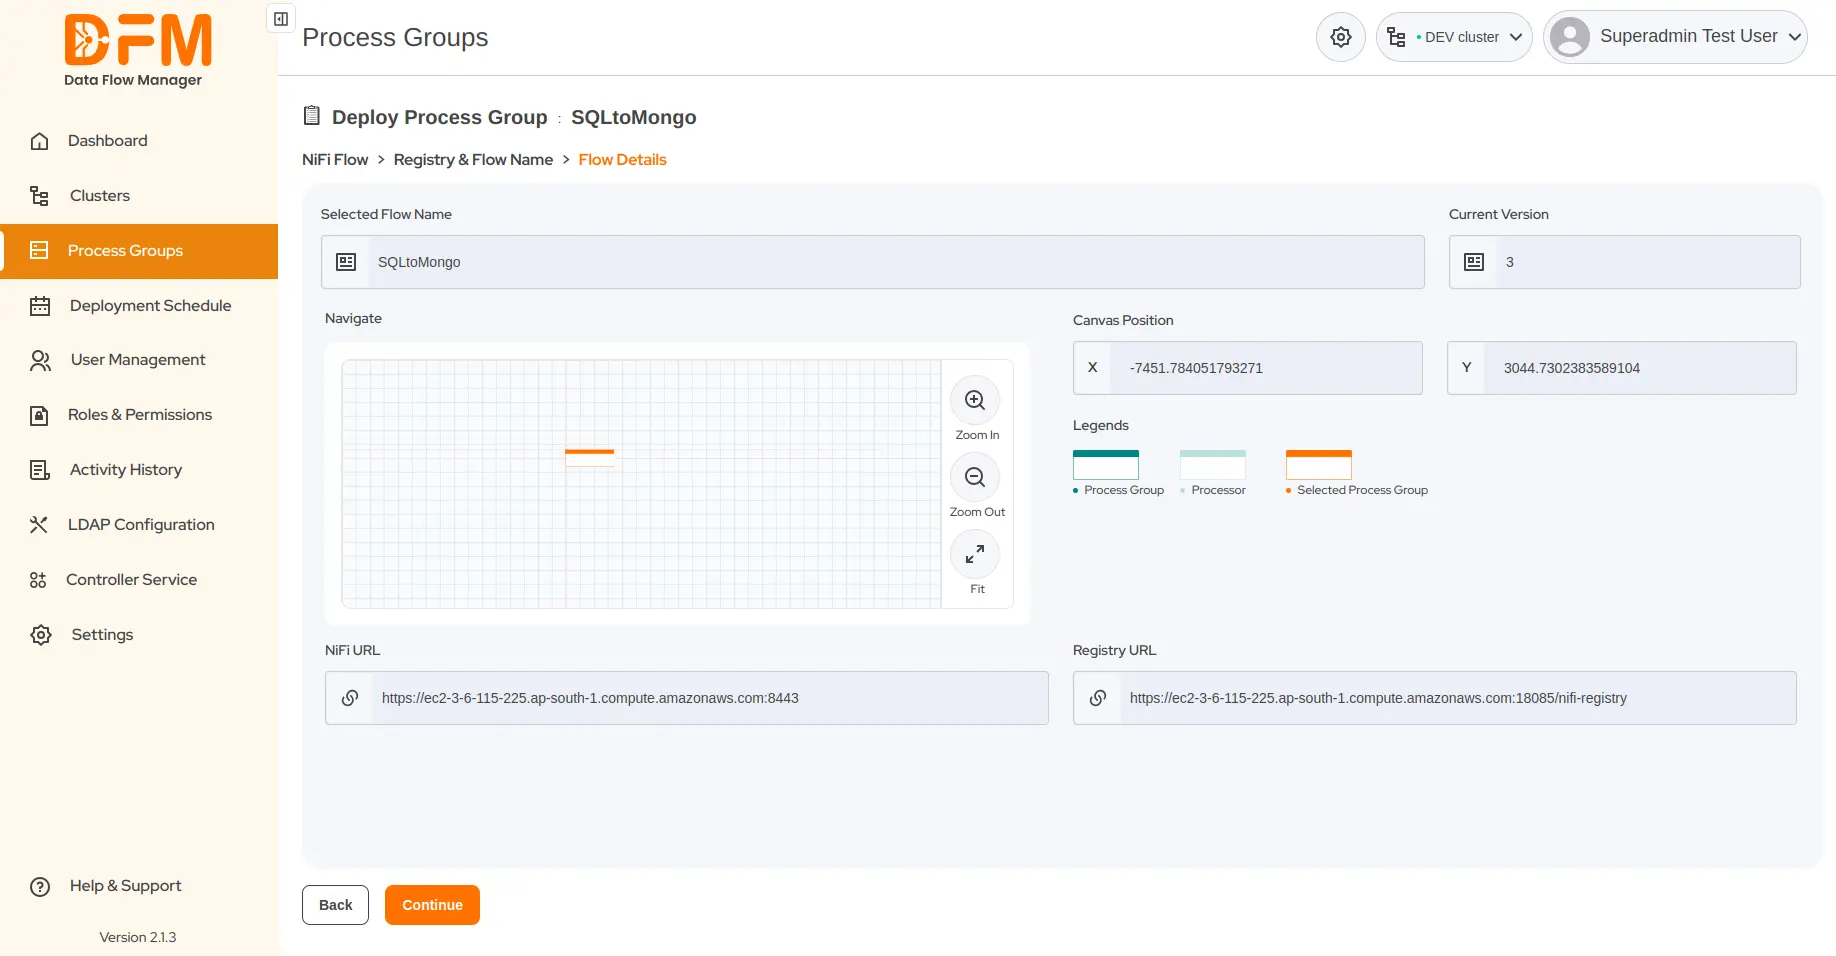
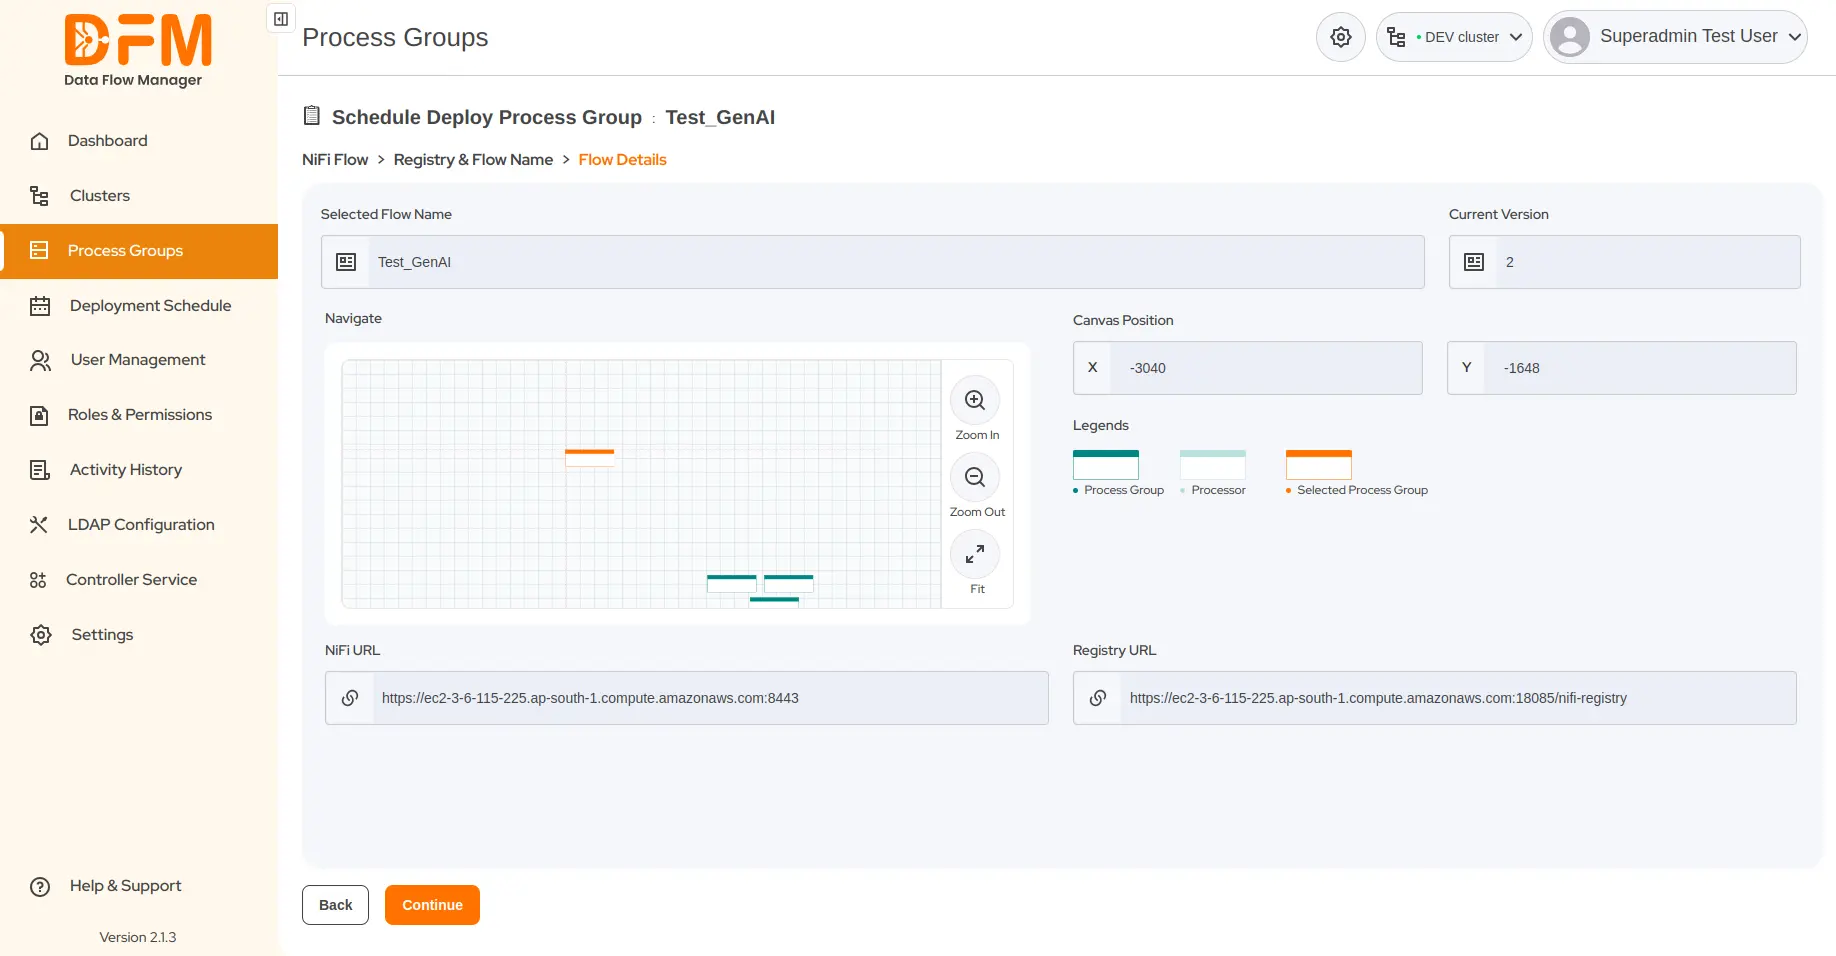
- Set the canvas position where your process group will be displayed on the NiFi UI.
- Drag your process group left, right, up, or down to set its position and click Continue.
-
Visual indicators to identify your current process group:
- Blue Shade: A processor that is highlighted with a blue shade indicates that it is currently active or selected.
- Light Shade: A processor with a light shade represents one that is not selected or not actively being edited.
- Orange Shade: A process group highlighted in orange implies that it is being deployed.
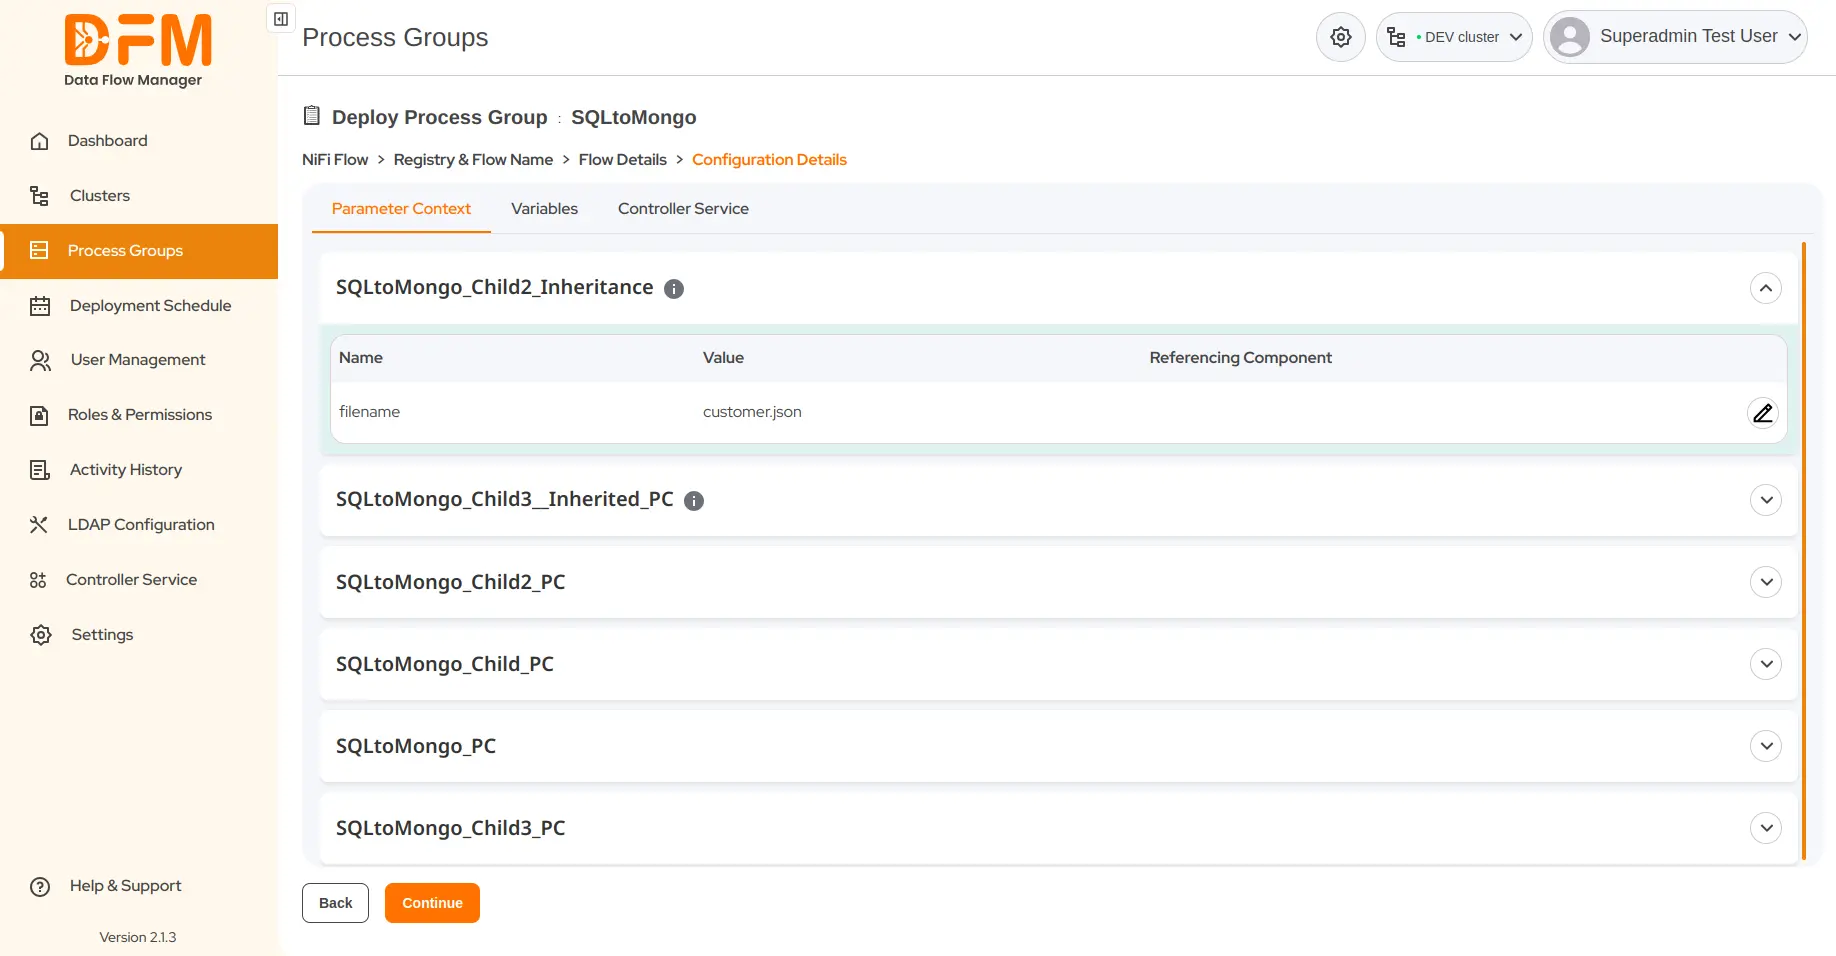
- Edit parameter context or variables with the necessary configurations. Additionally, you can view any inherited parameters by referencing the component.
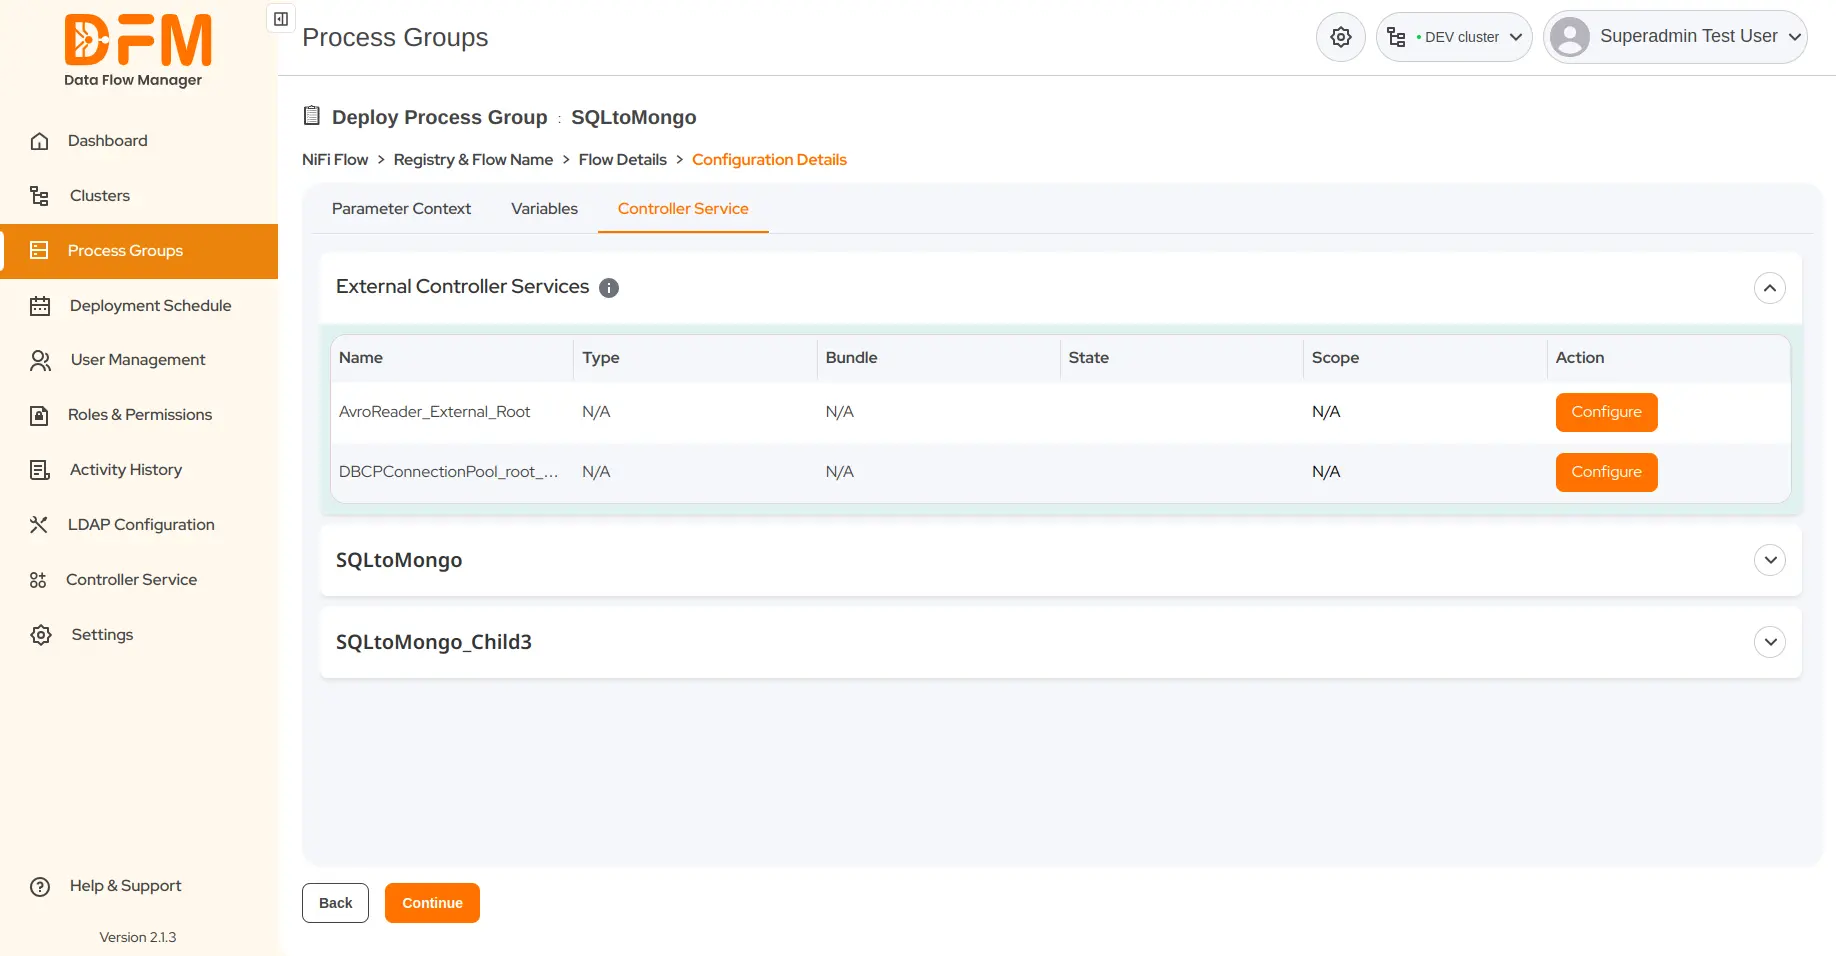
- View all the controller services available within the process group. Configure the required ones.
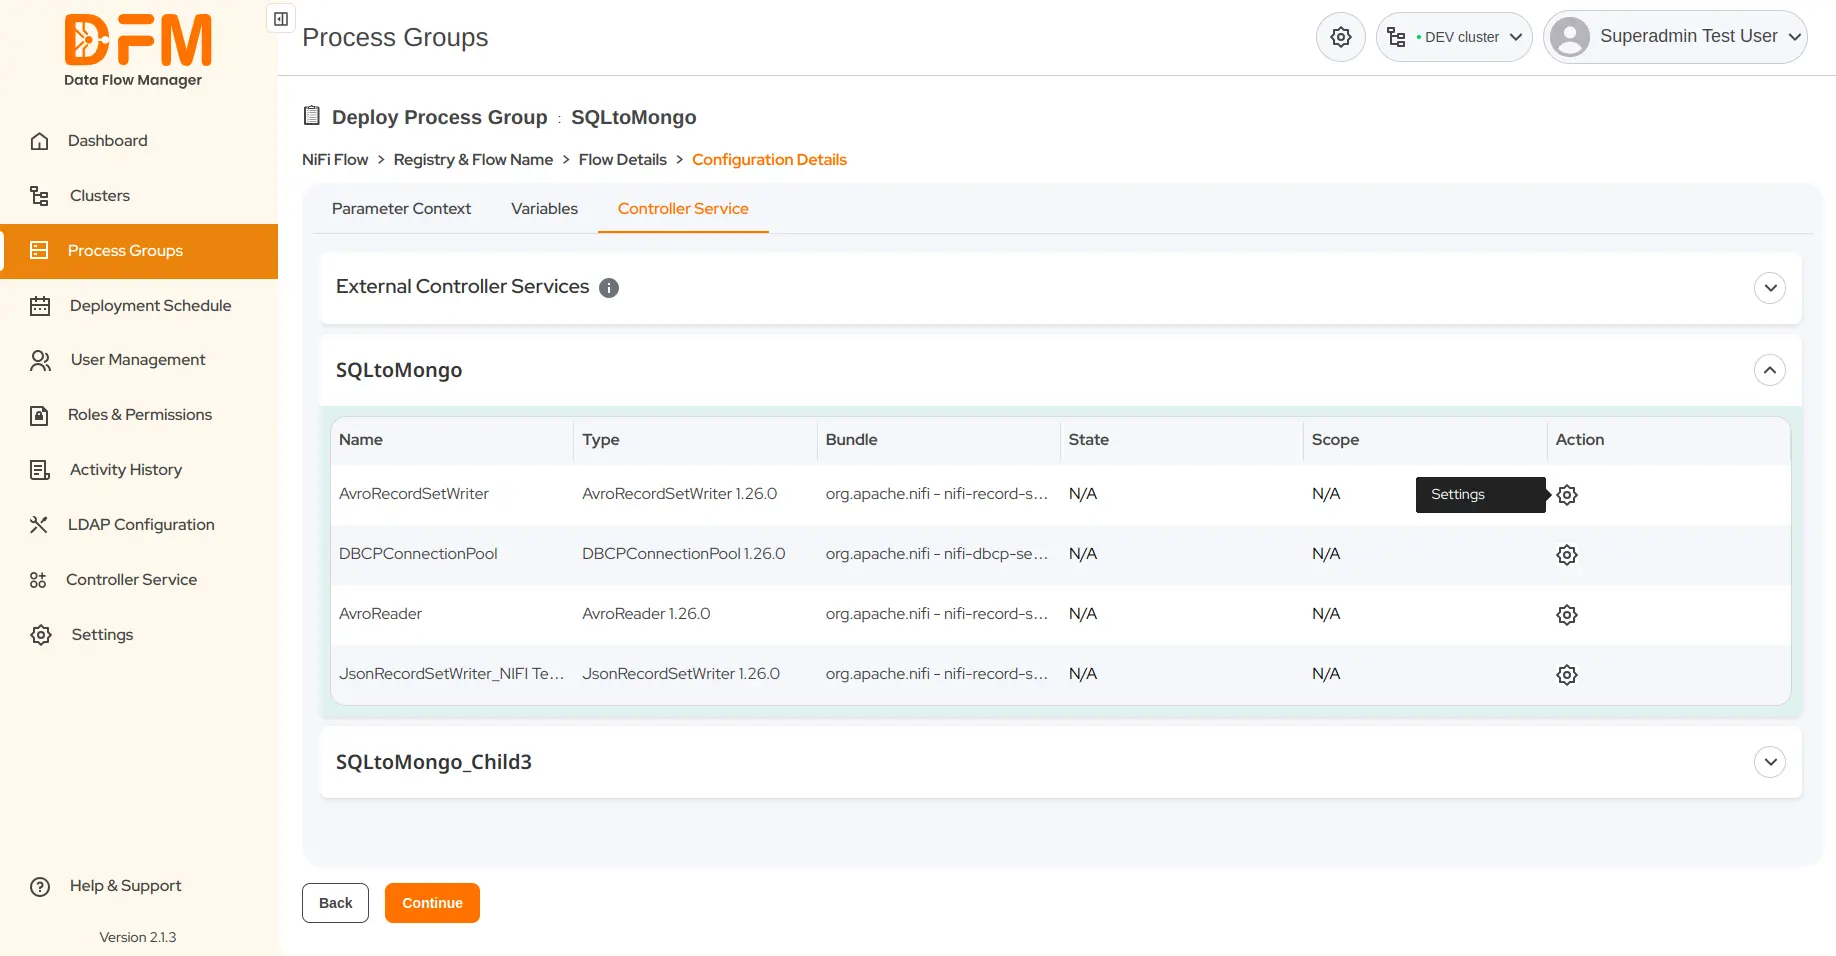
- If needed, you can edit the properties of the controller services through the settings option and continue.
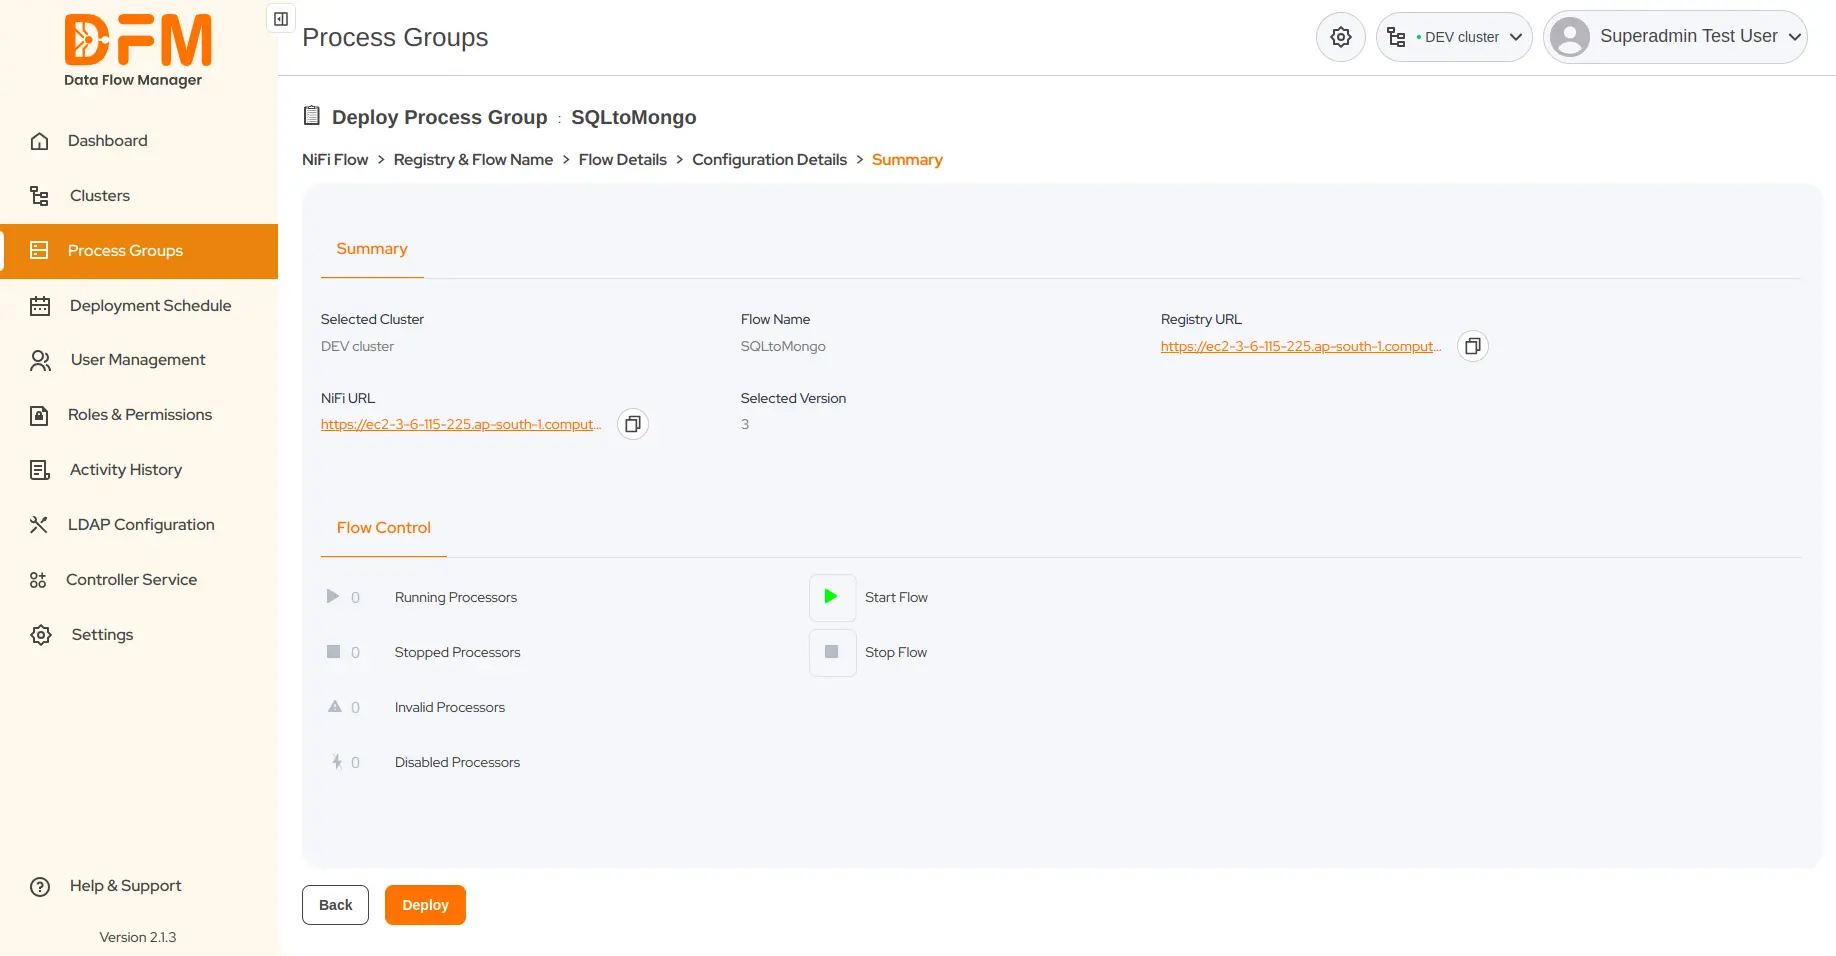
- You will be redirected to the summary page. Verify the details of the process group.
- Ensure that you start the flow and click Deploy.
- After clicking Deploy, you get a confirmation message about the successful deployment of your process group. If there are any errors, the message provides the details, allowing you to take the necessary actions.
4.3. How to upgrade a process group?
Upgrading a process group means deploying the latest version of the flow to the target cluster. Let’s say you made changes to the process group and committed to the registry, which will create version 2 of the process group. To deploy version 2, you can simply upgrade the process group.
If you choose to deploy it, Data Flow Manager will create a new copy of the process group on the target cluster, leaving the original version unchanged.
To upgrade a process group:
- Navigate to the process group under the Process Group tab.
- From the Actions column, click the Upgrade button.

- Choose the flow version that you want to deploy and Continue.
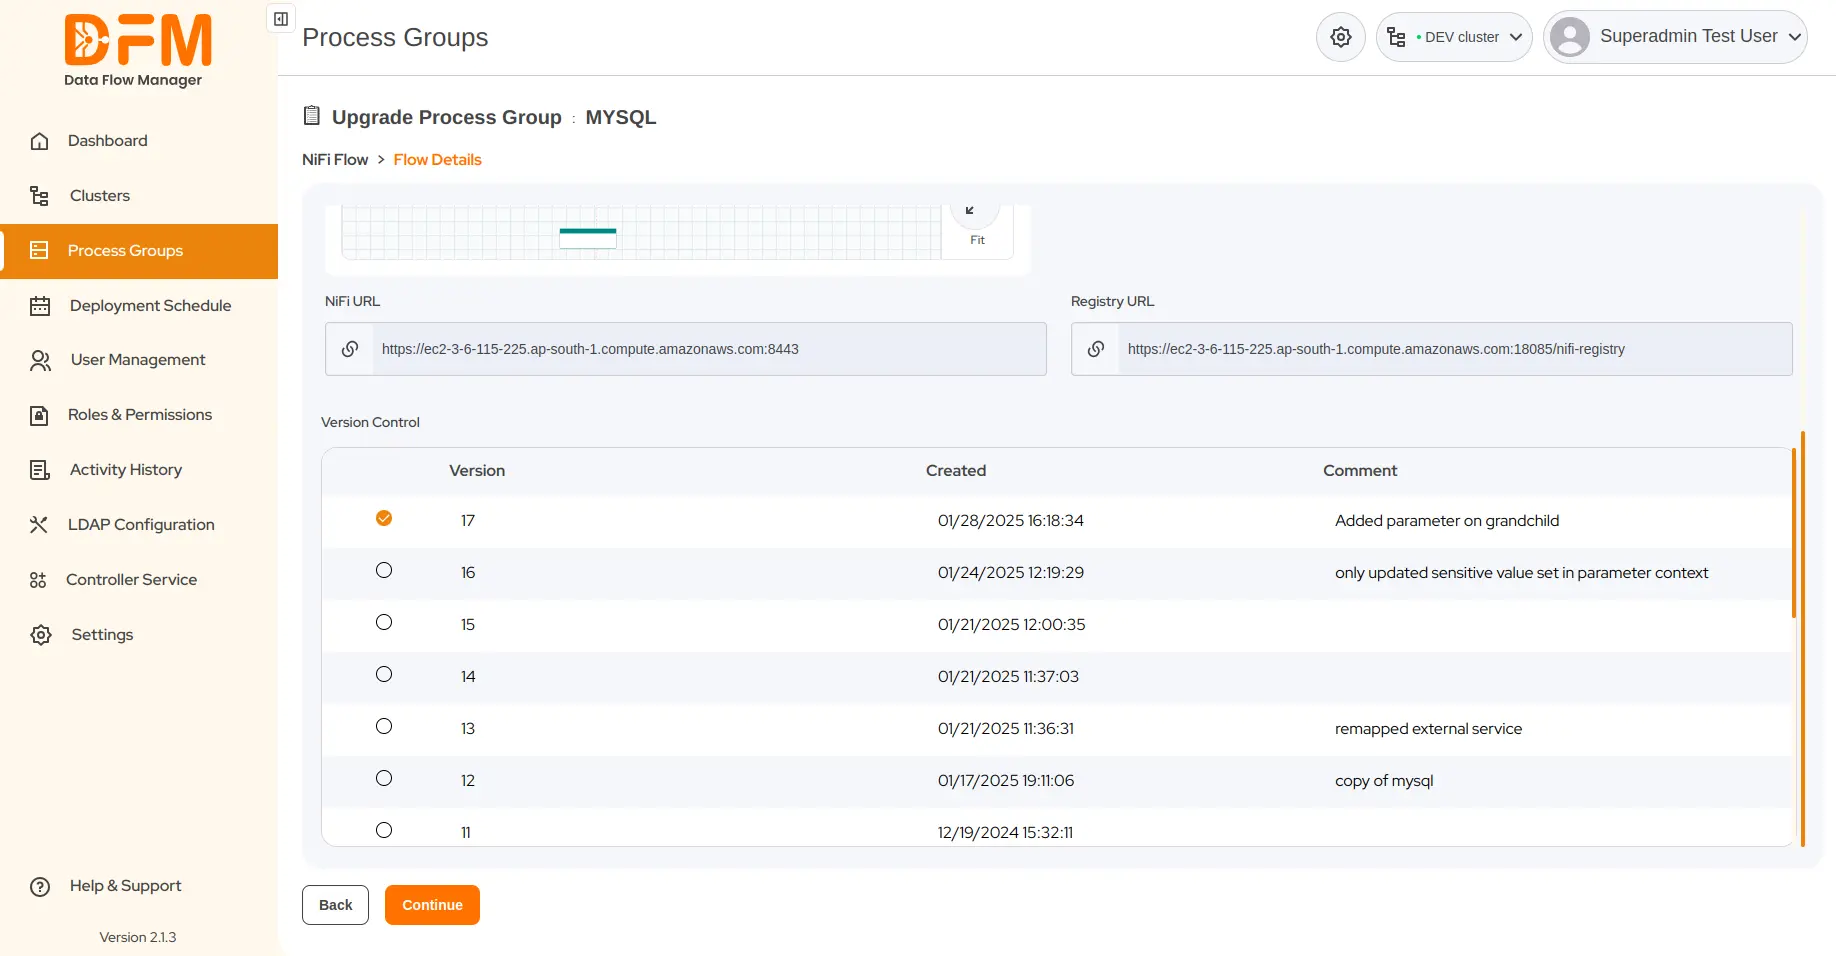
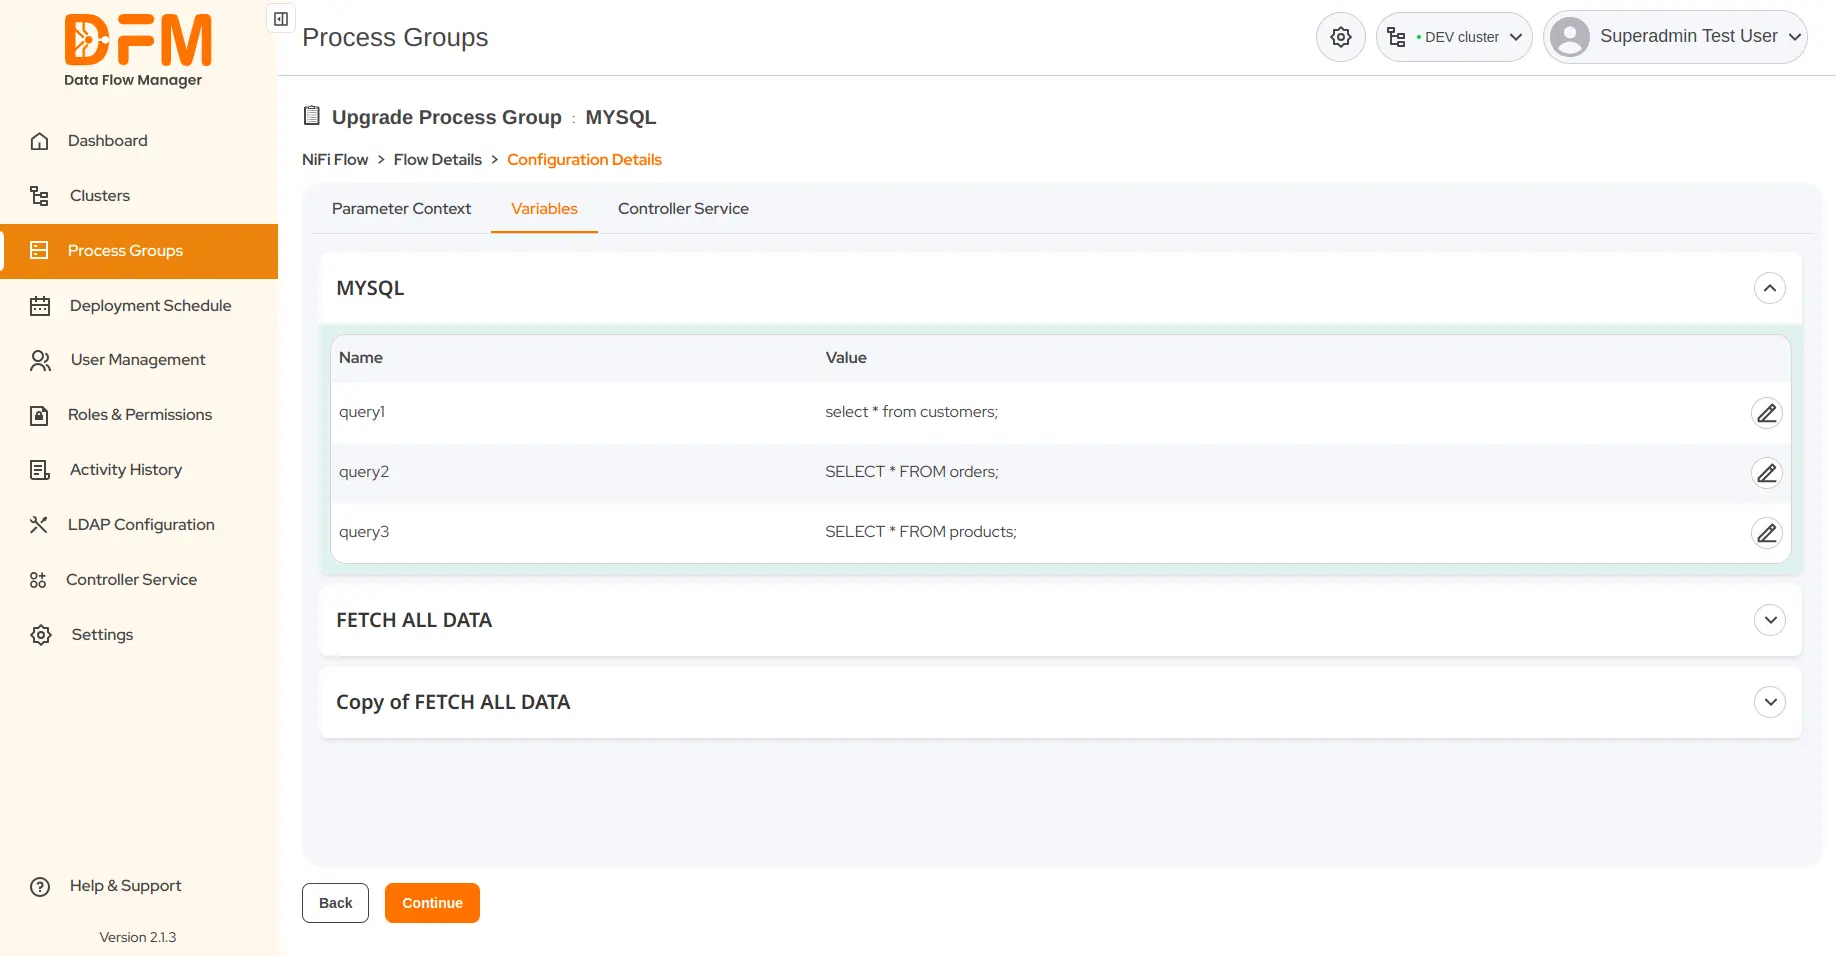
- Edit parameter contexts or variables, configure the controller service, and continue.
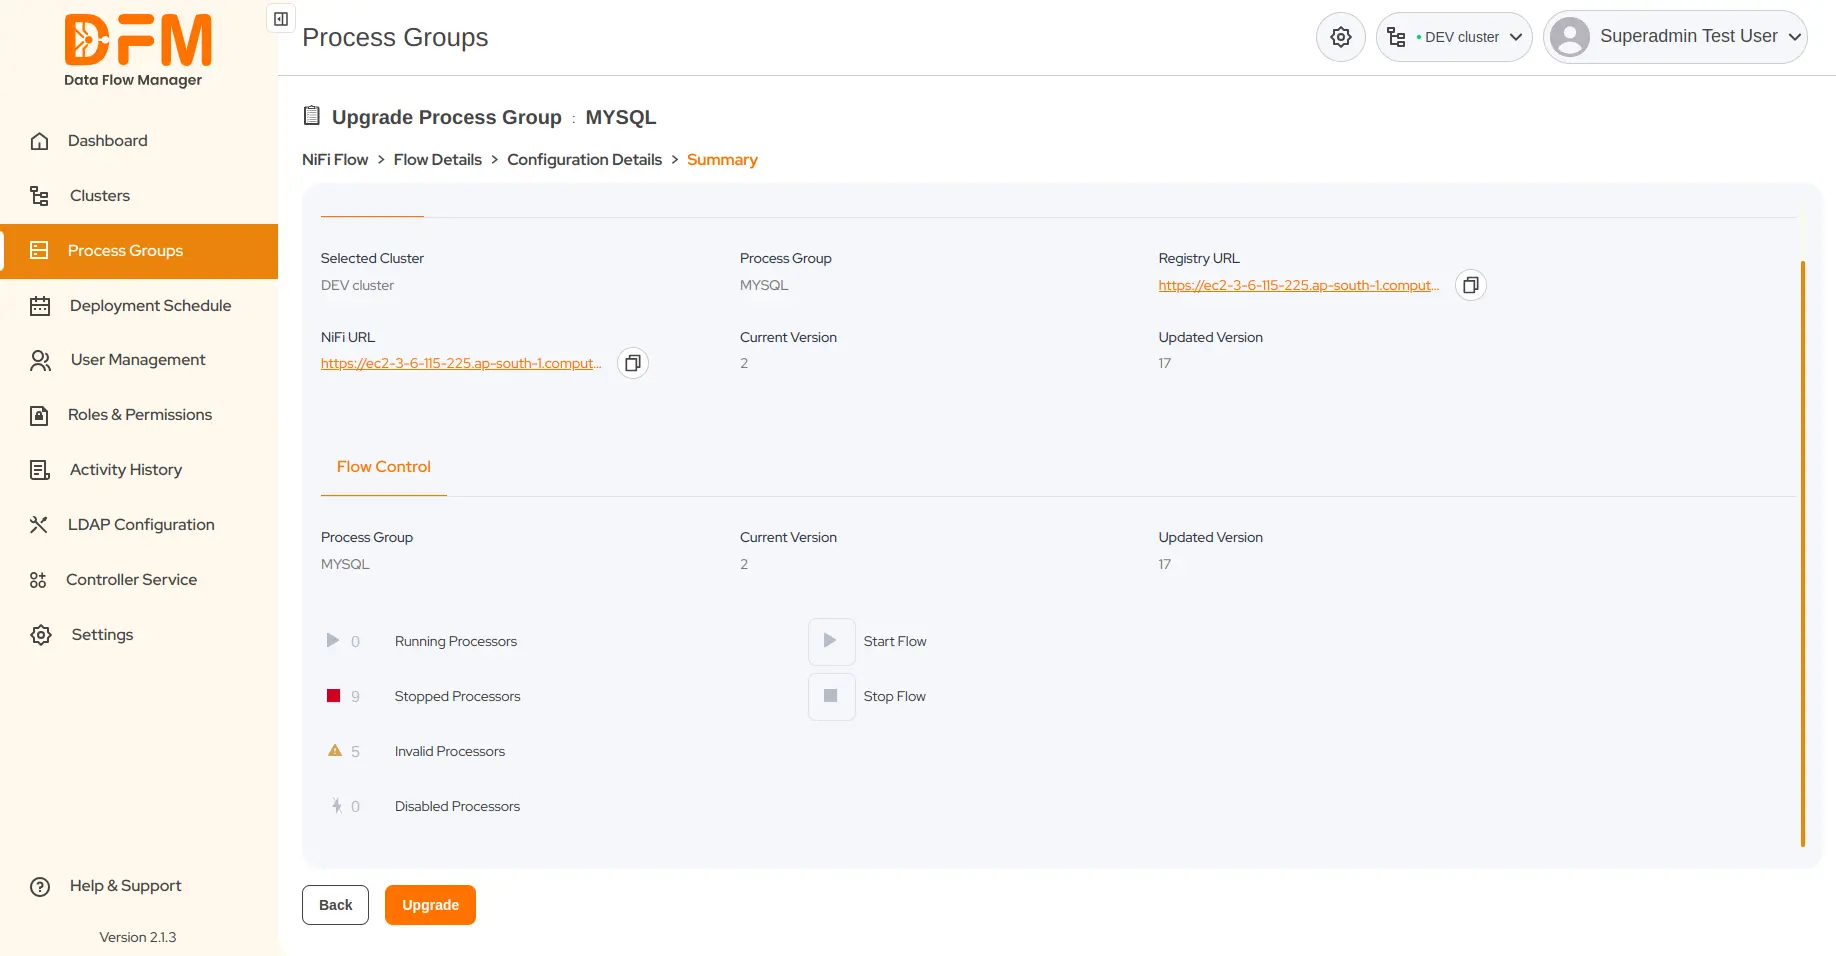
- Verify the process group details, choose whether to start or stop the flow, and click Upgrade.
- You get a confirmation message about the successful upgrade of the flow version.
4.4. How to schedule the deployment of a process group?
Scheduling the deployment of a process group at a specific time enables you to automate rollouts during off-peak hours. This minimizes disruptions to critical operations and ensures a seamless deployment of process groups, reducing manual interventions and the risk of errors.
However, the scheduled process group deploys only if the admin or manager approves it. If it is not approved within the scheduled time, the process group will not get deployed. You can reschedule the deployment for a later time.
To schedule the deployment of a process group:
- Click the Schedule Deployment button on the top-right corner under the Process Groups tab.
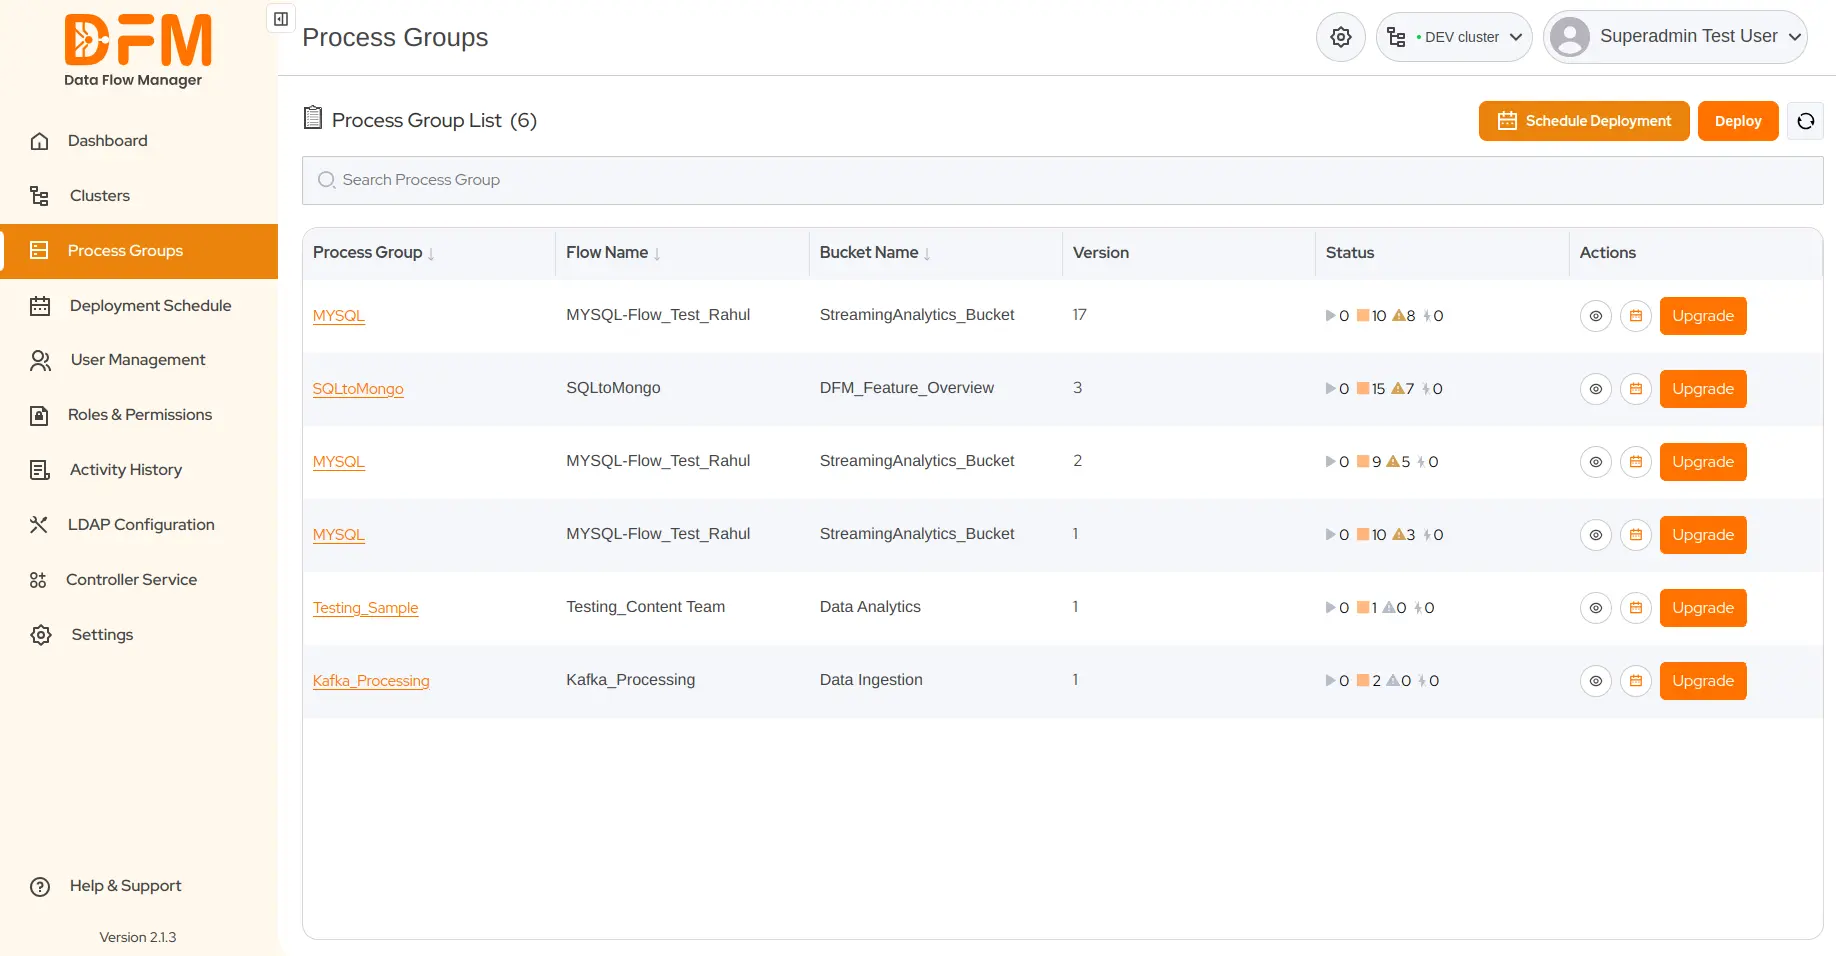
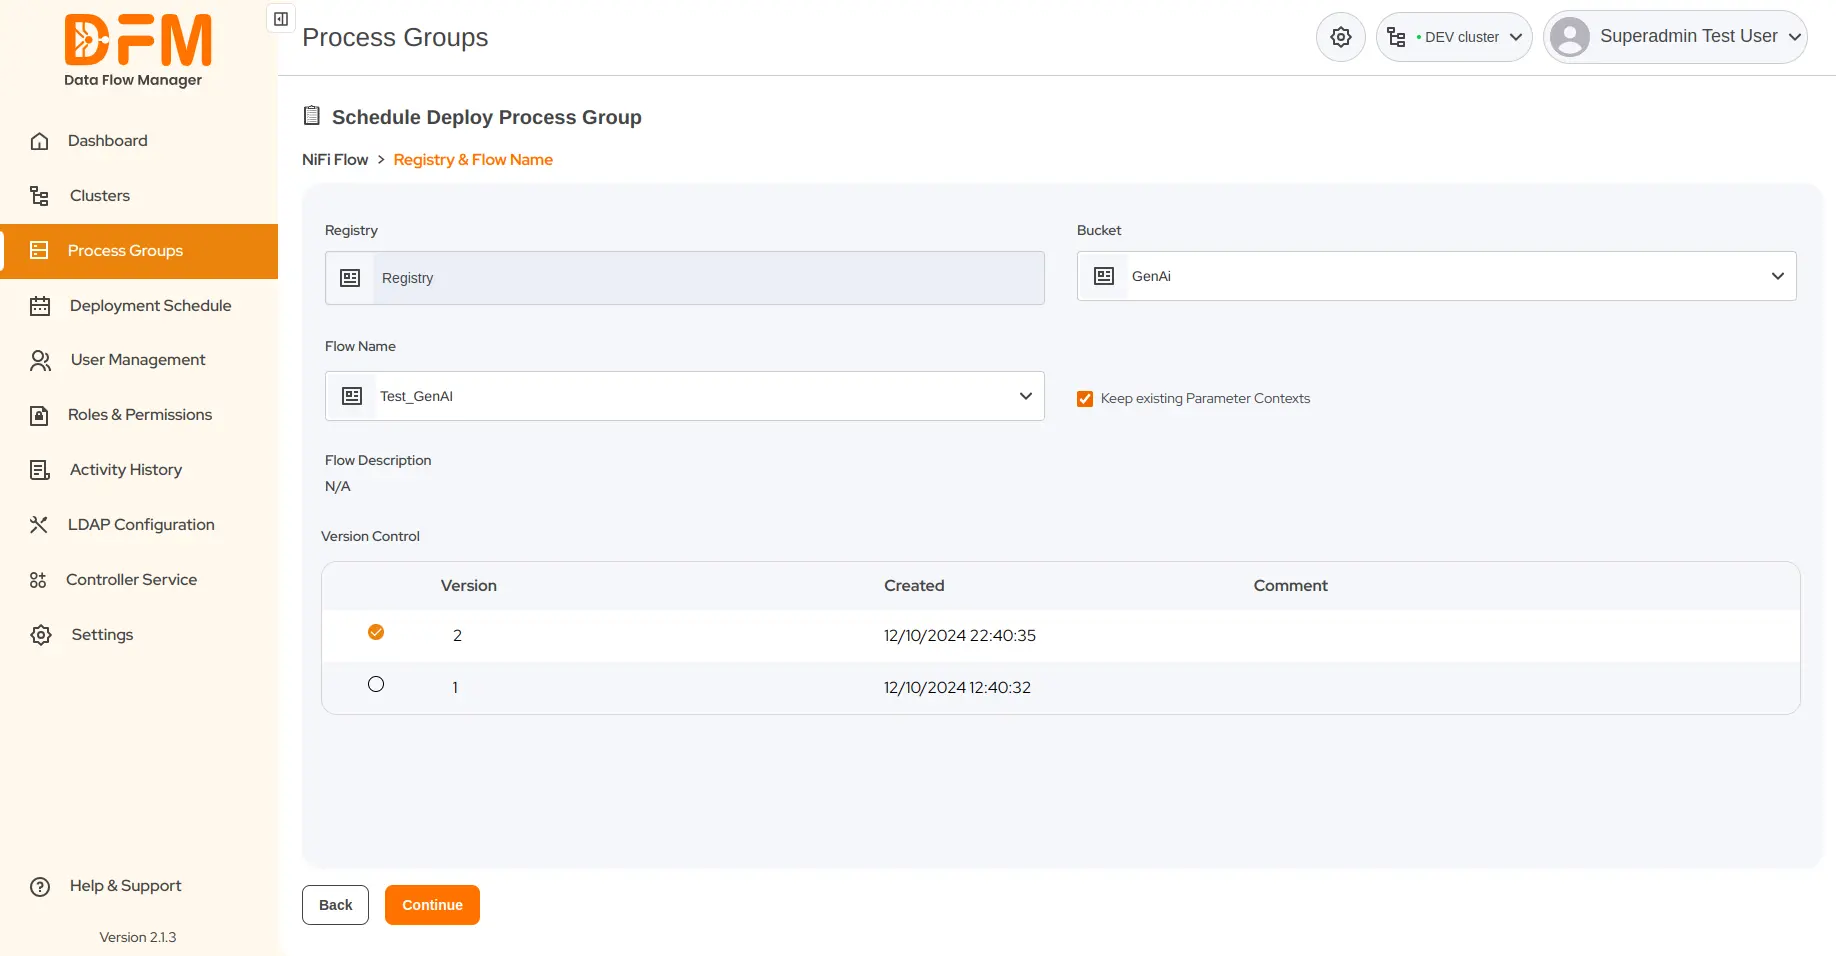
- Next, choose Bucket and Flow Name, and decide whether to keep the existing parameter contexts.
- Choose the flow version and click Continue.
- Set the canvas position for the process group and continue.
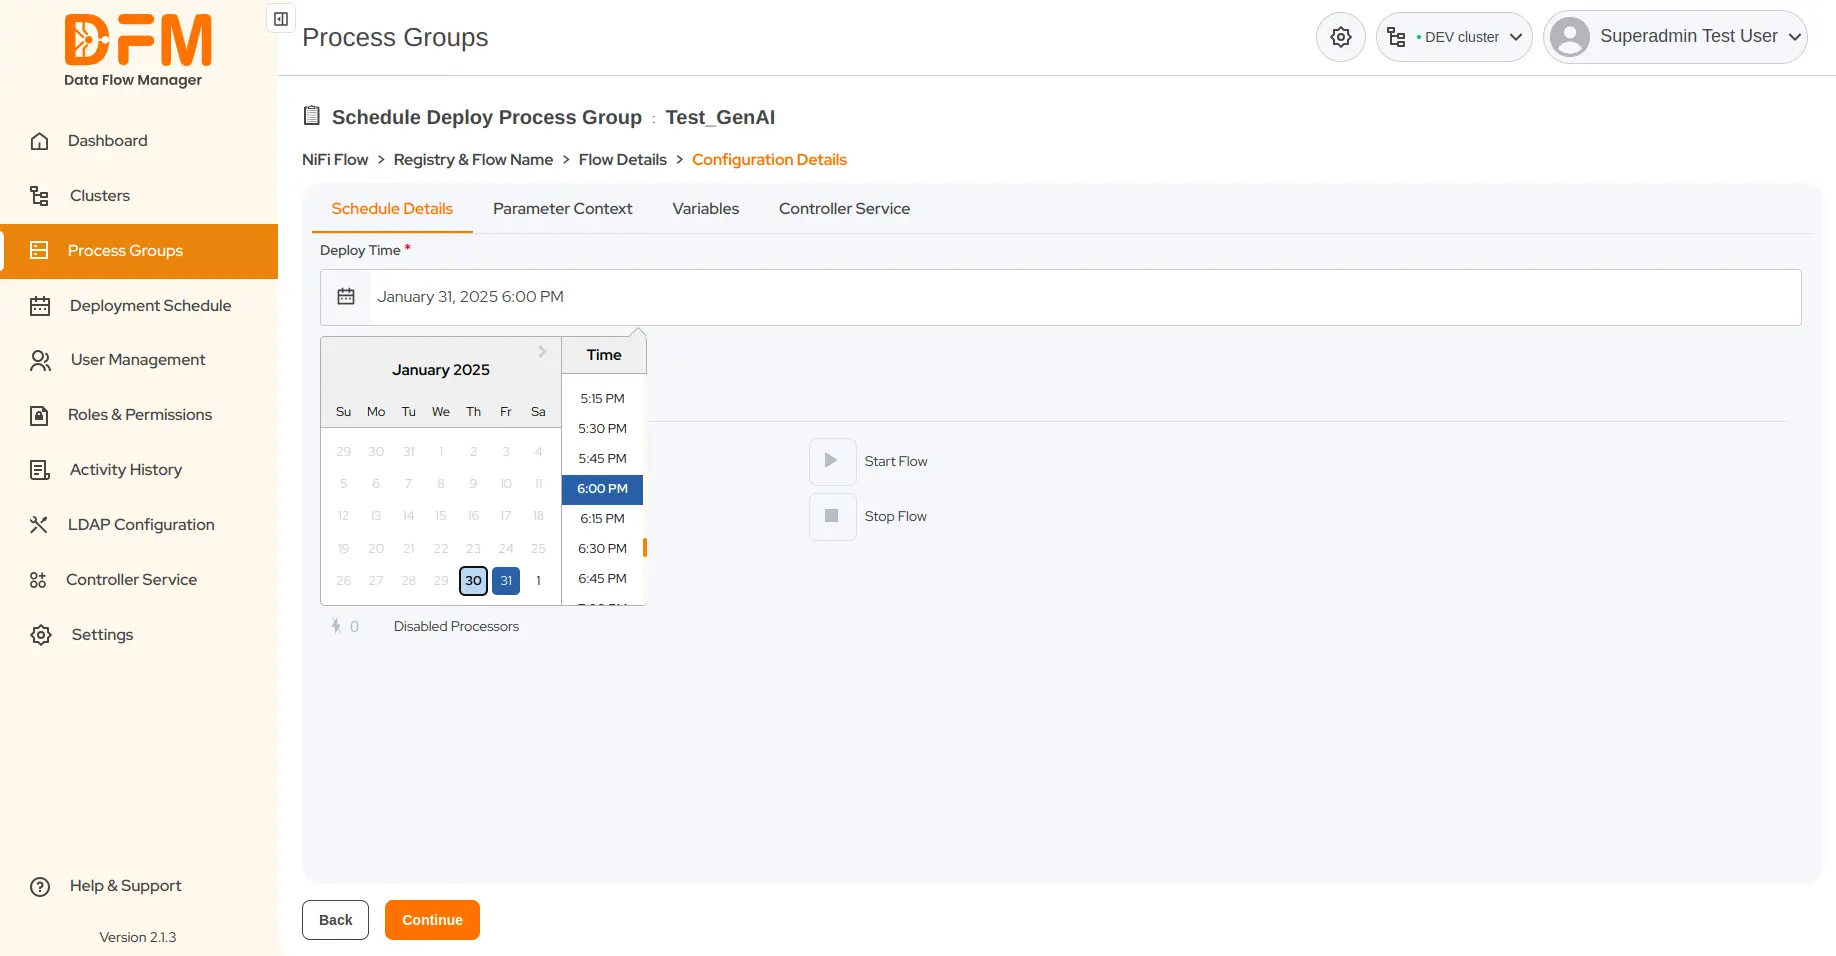
- Now, set the desired deployment time.
- Edit the parameter context and variables and configure the required external controller services.
- Ensure to start the flow and click continue.
- You’ll be redirected to the summary page. Verify the flow details and scheduled time. Click Schedule.
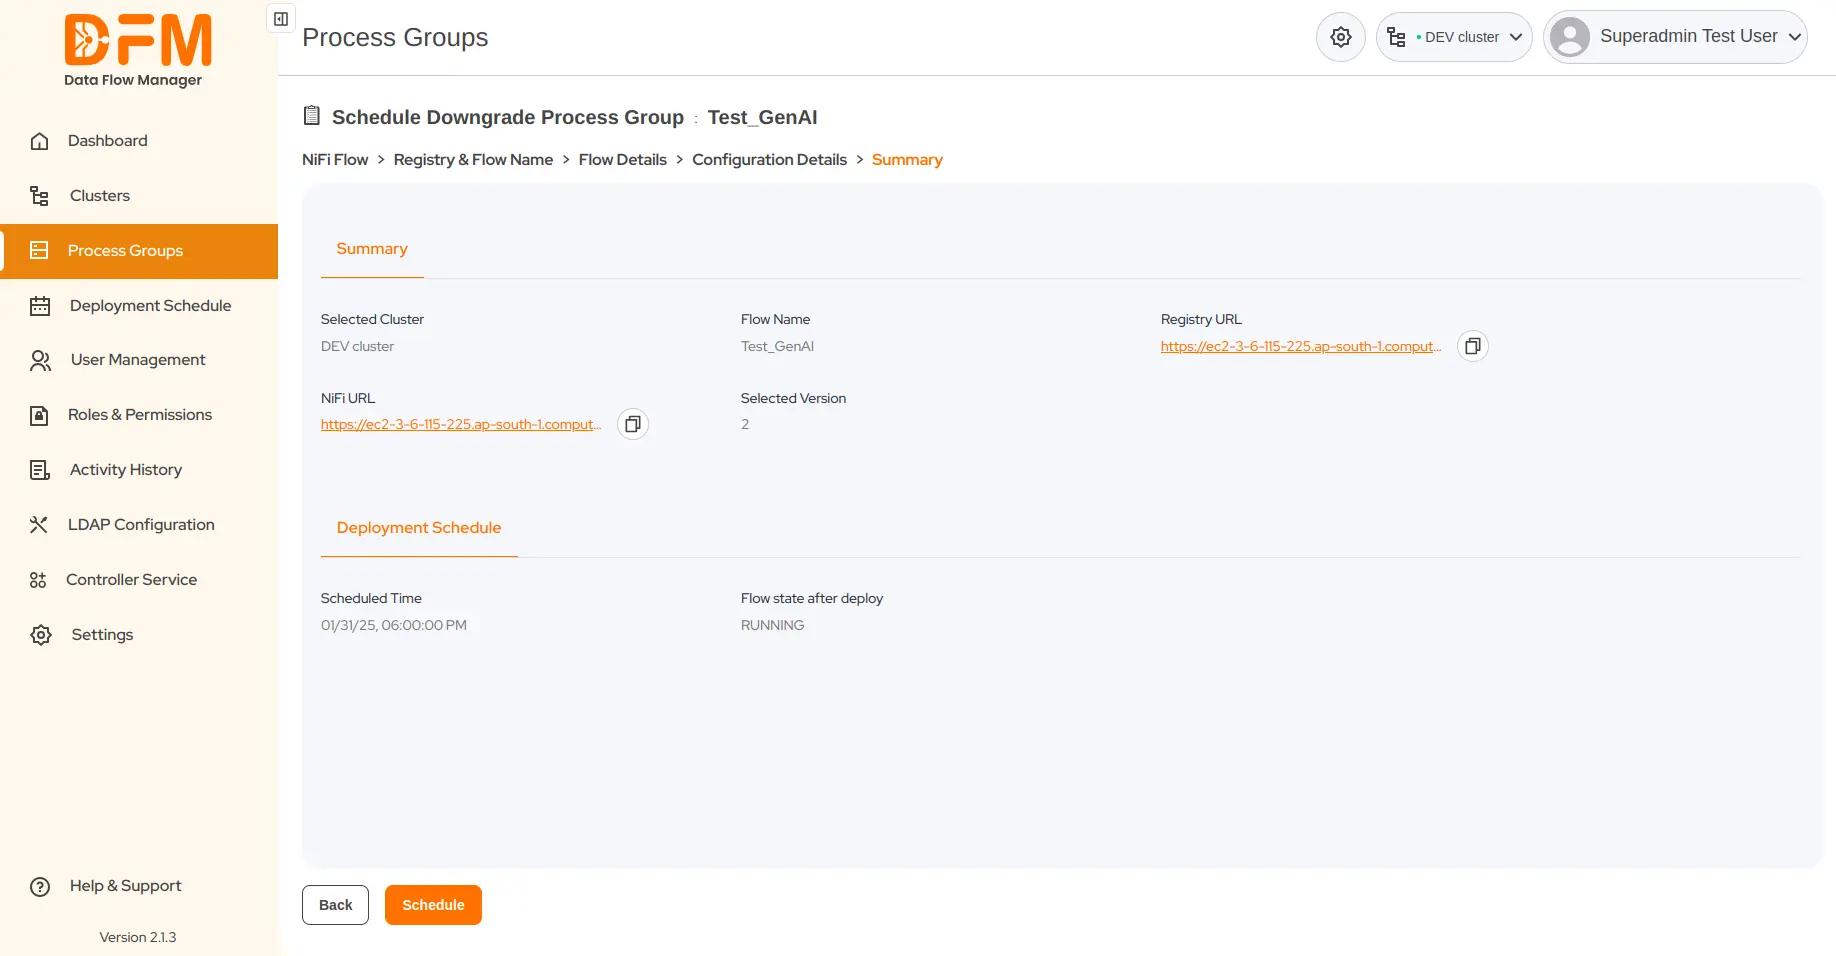
Your process group will be successfully deployed at the scheduled time.
4.5. How to schedule the upgrade of a process group?
To schedule the upgrade of a process group:
- Go to the Process Groups tab where you will find the list of process groups from the clusters you are currently logged in to.
- Decide the process group that you want to schedule for an upgrade. Click the calendar icon from the Actions column of the selected process group.
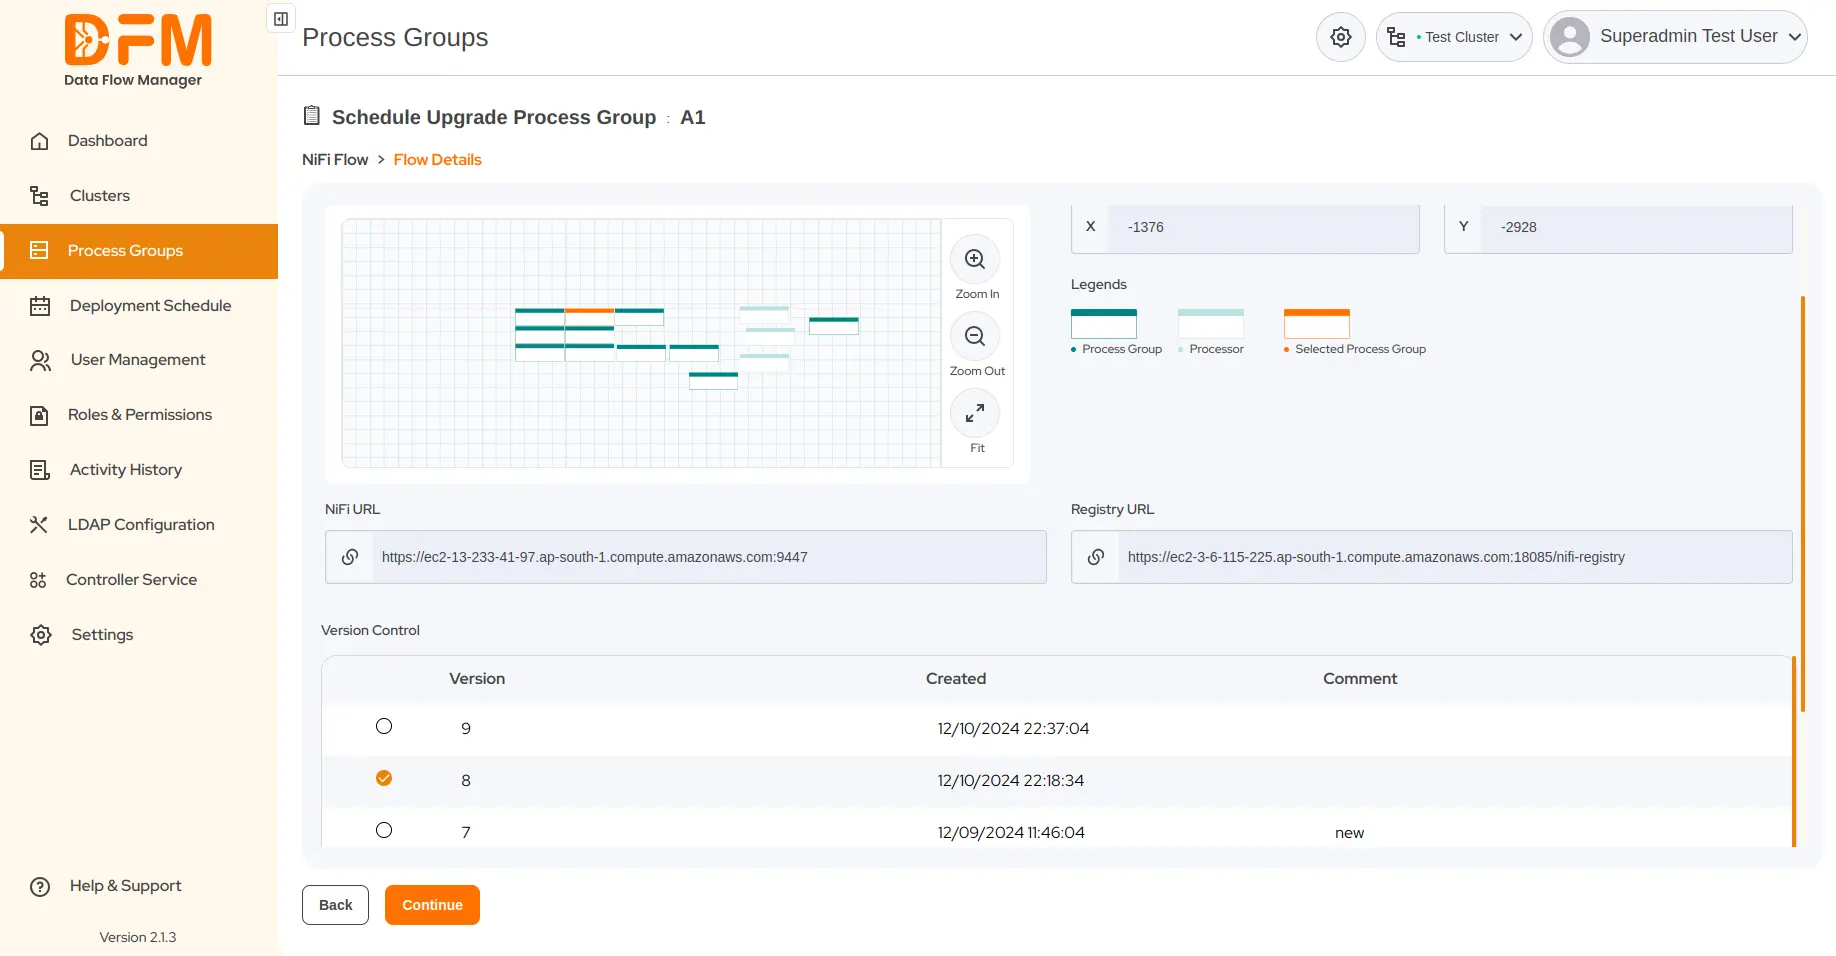
- Select the flow version and continue.
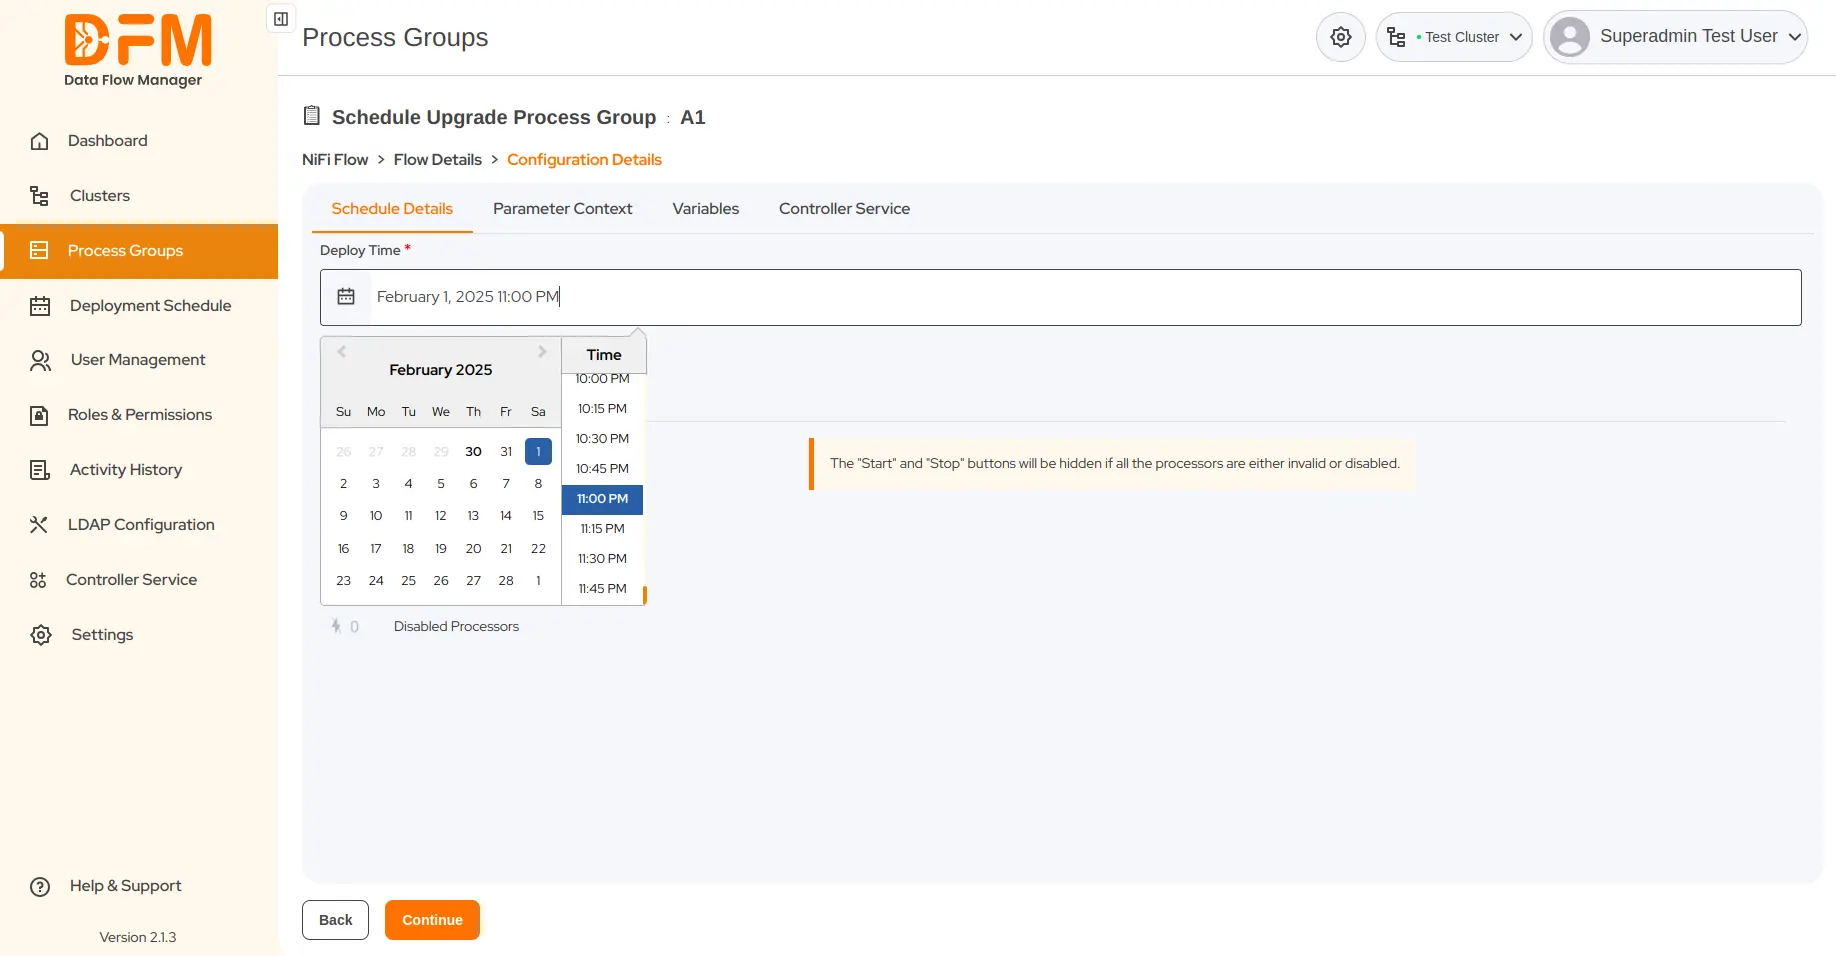
- Set the date and time for the upgrade. Choose to start the flow, if needed.
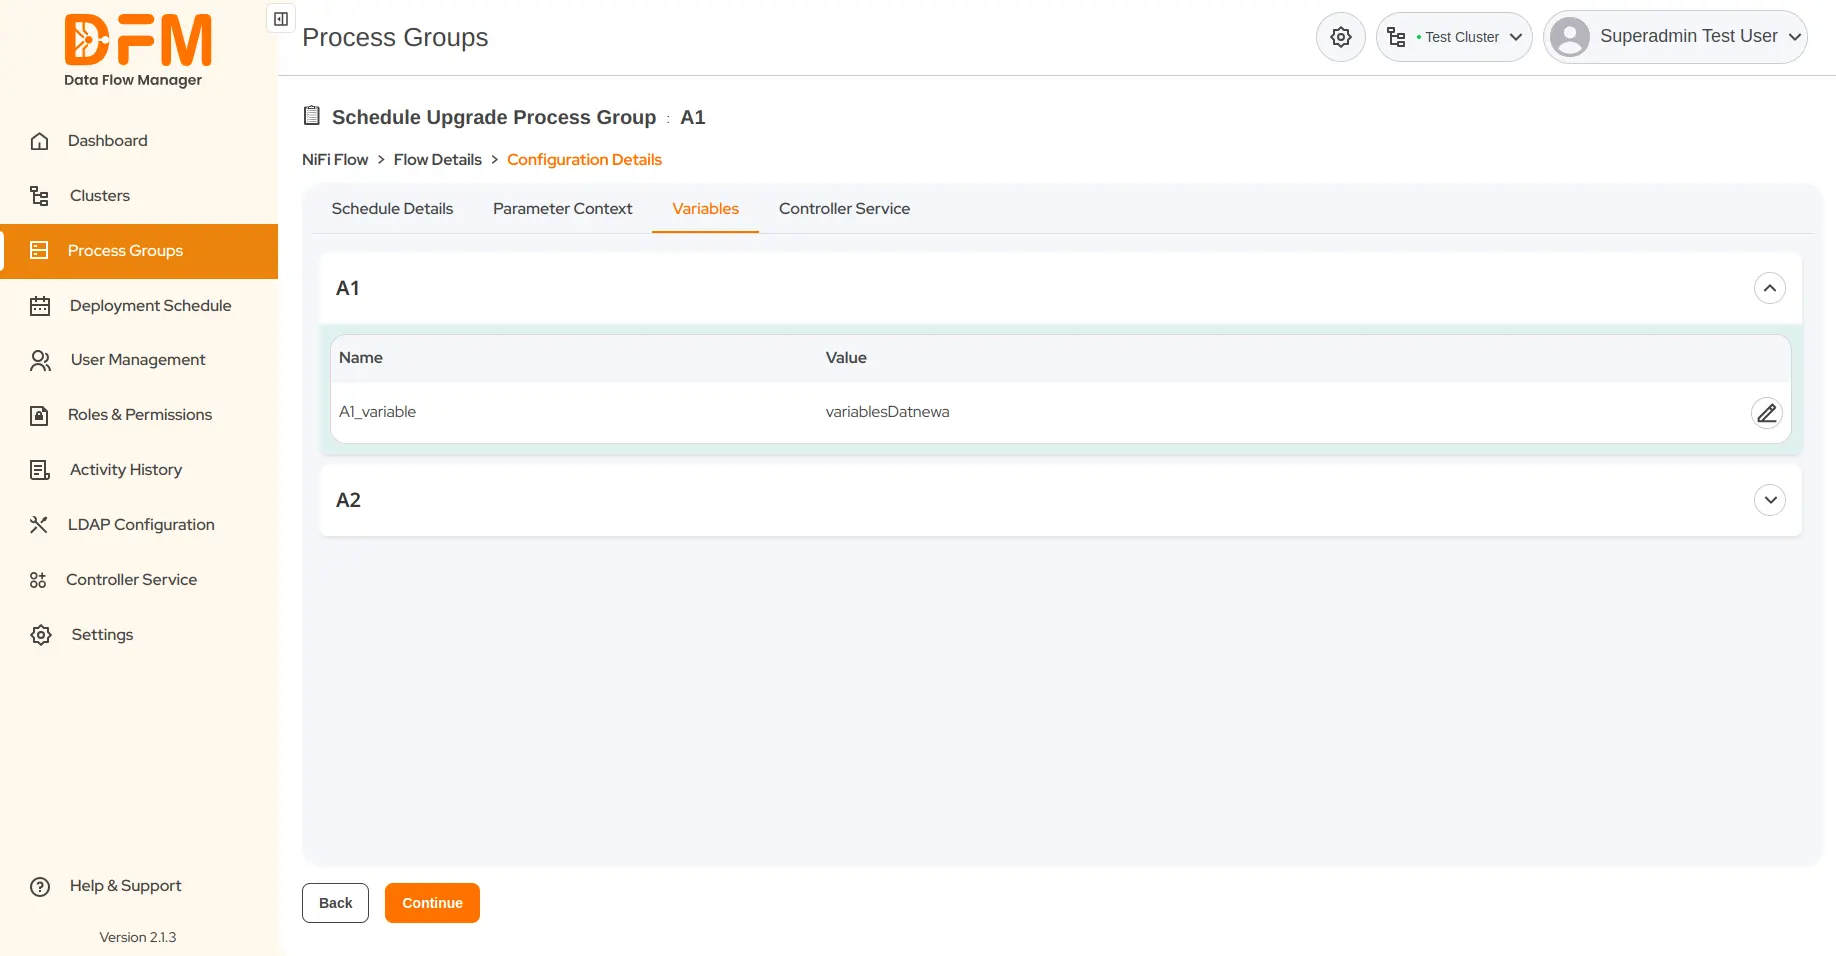
- Edit the parameter contexts and variables, if required.
- Configure the required controller services.
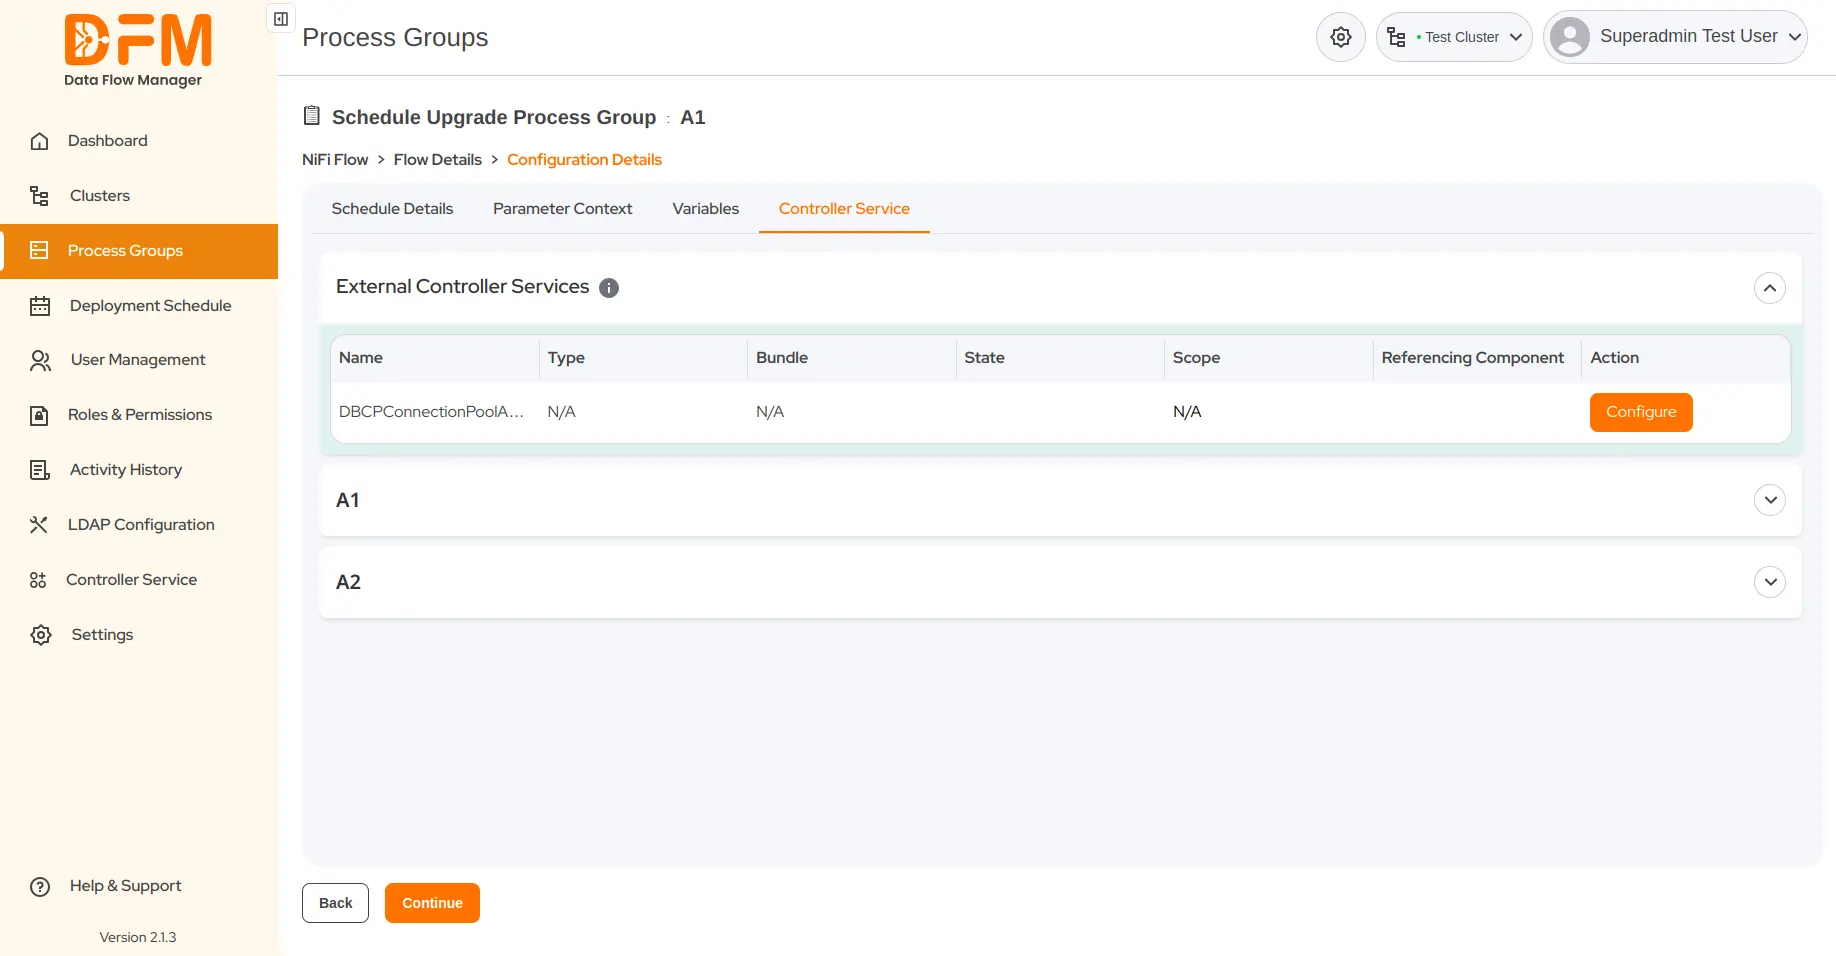
- Click Continue. You’ll be directed to the summary page containing the flow details and the scheduled time. Verify them and schedule the upgrade.
4.6. Edit parameter contexts and variables of a process group while deploying or upgrading it
You can edit parameter contexts and variables while deploying a process group. After you select the Bucket and Flow name, choose the flow version, and set the canvas position, you get the list of parameter contexts and variables used by the process group you are currently deploying or upgrading.
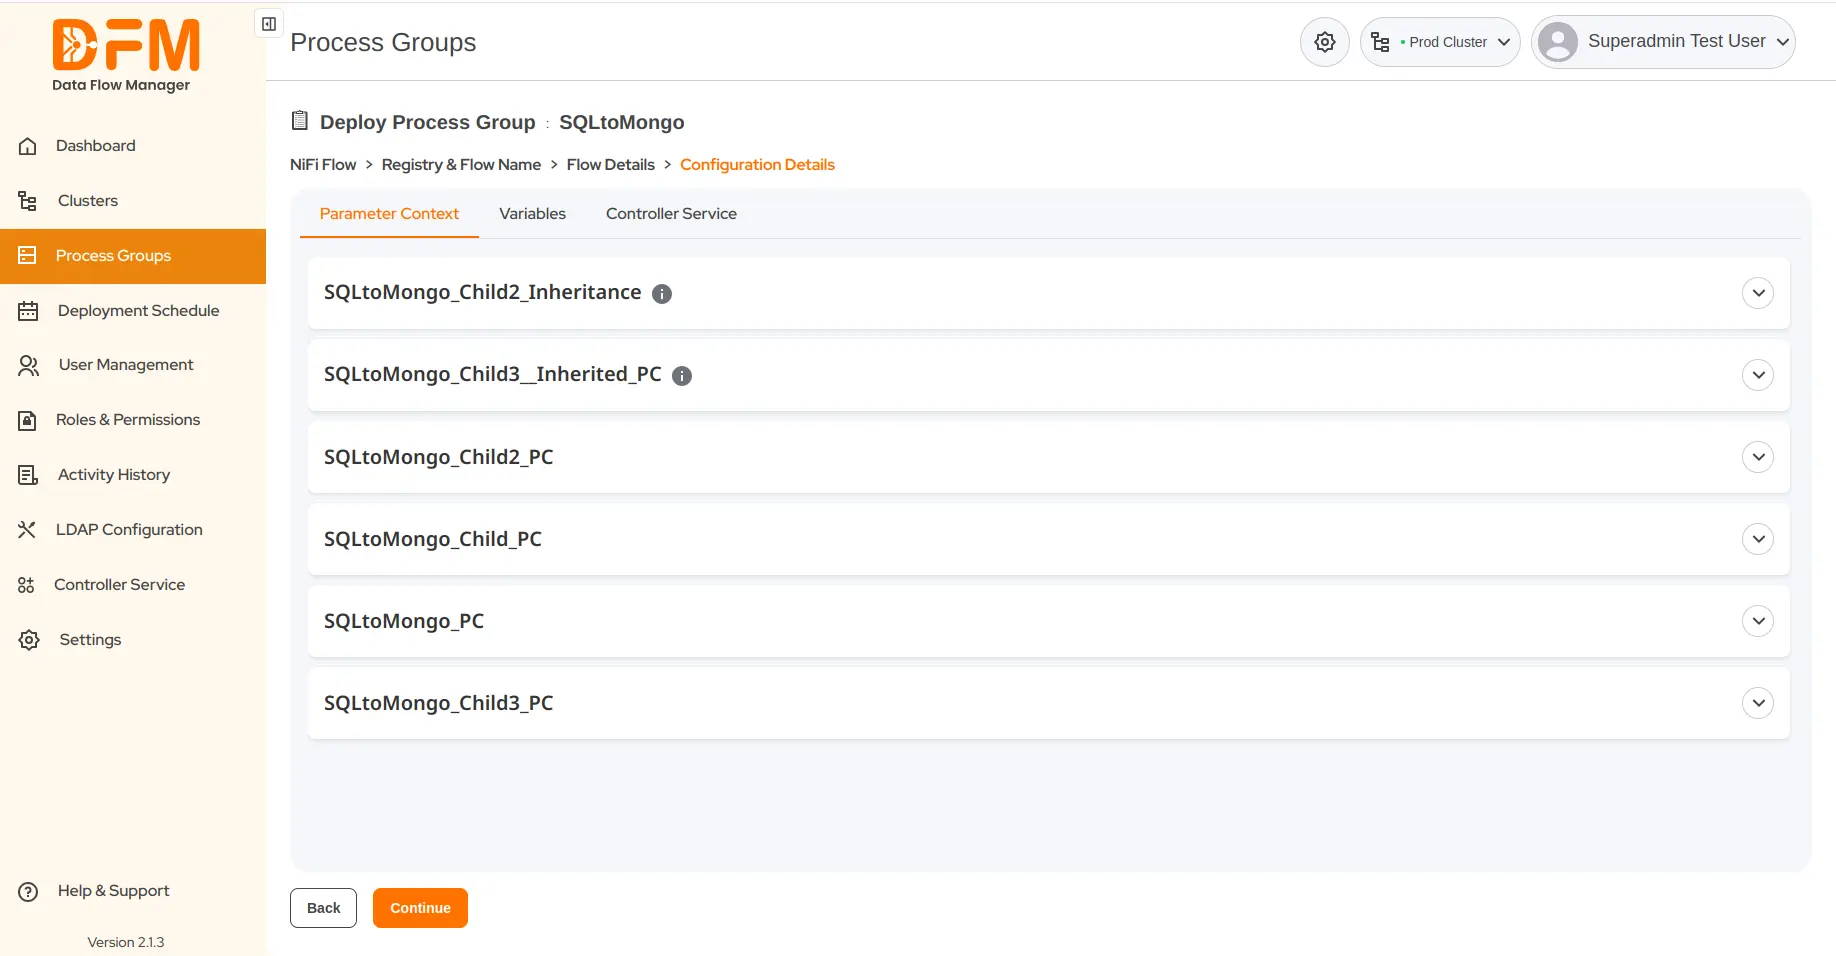
To edit the parameter context,
- Choose the one that you want to edit. Click on the edit icon next to the parameter content.
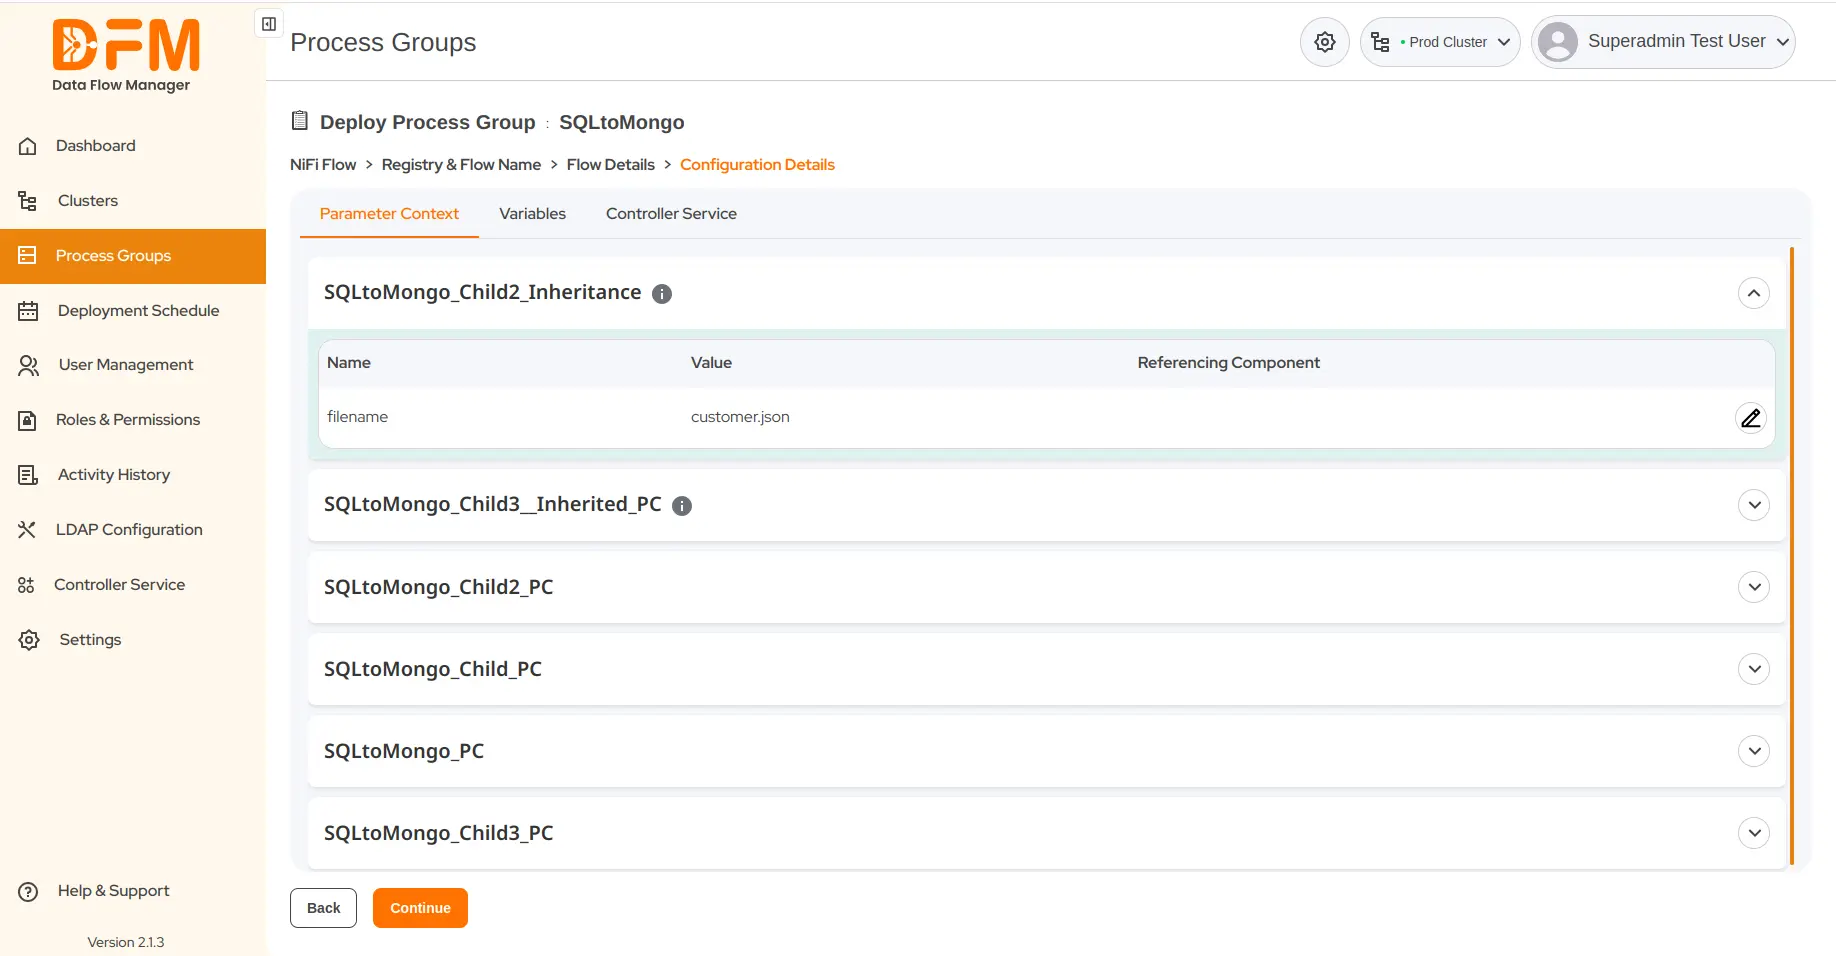
- Add the description and click Save.
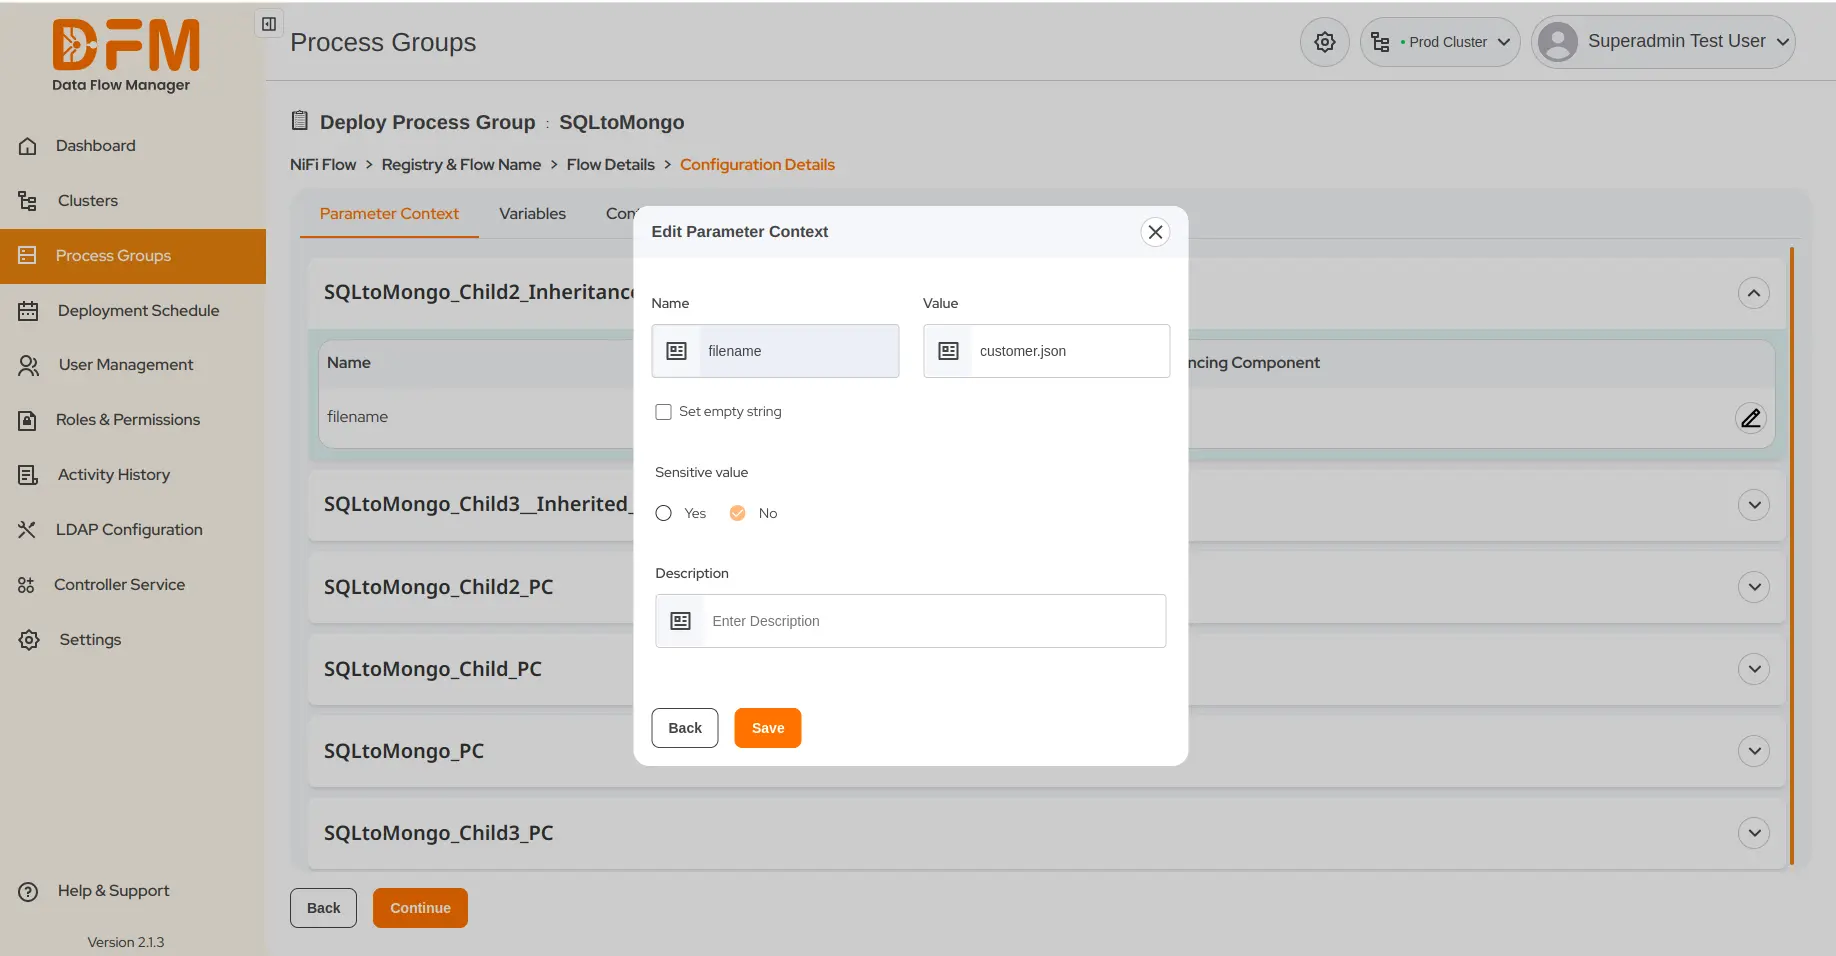
To edit variables:
- Go to the Variables tab. You’ll see all variables used by the process group.
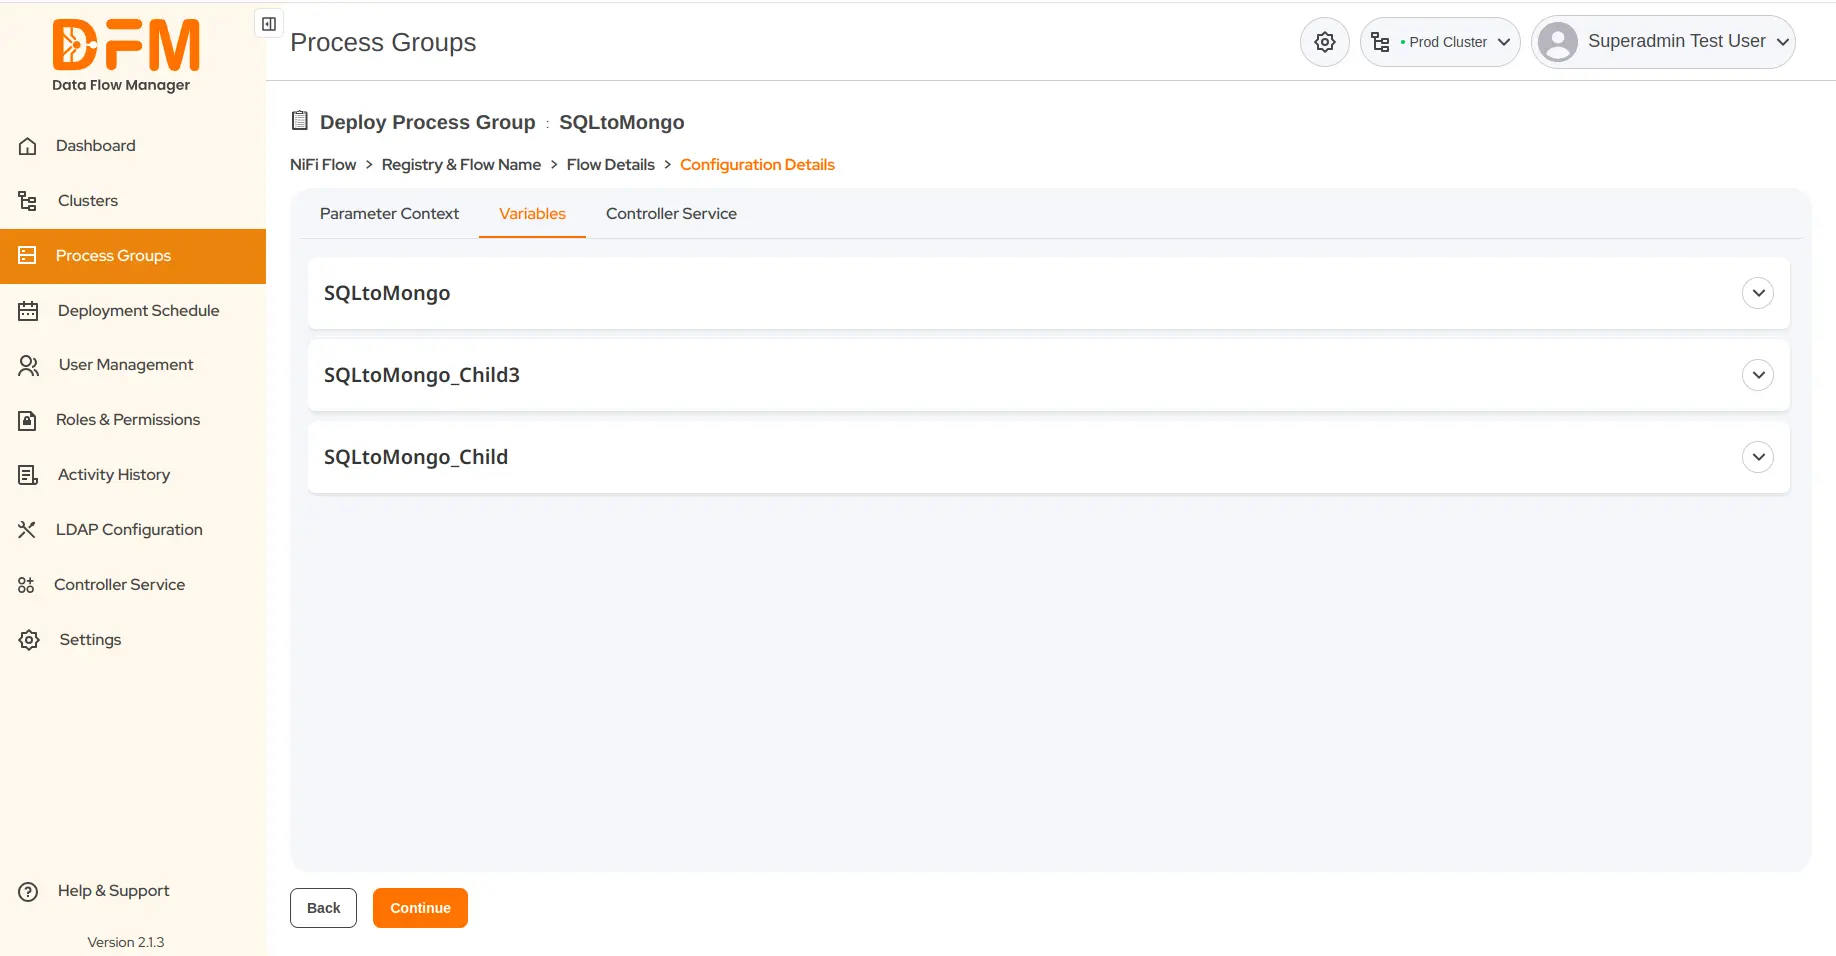
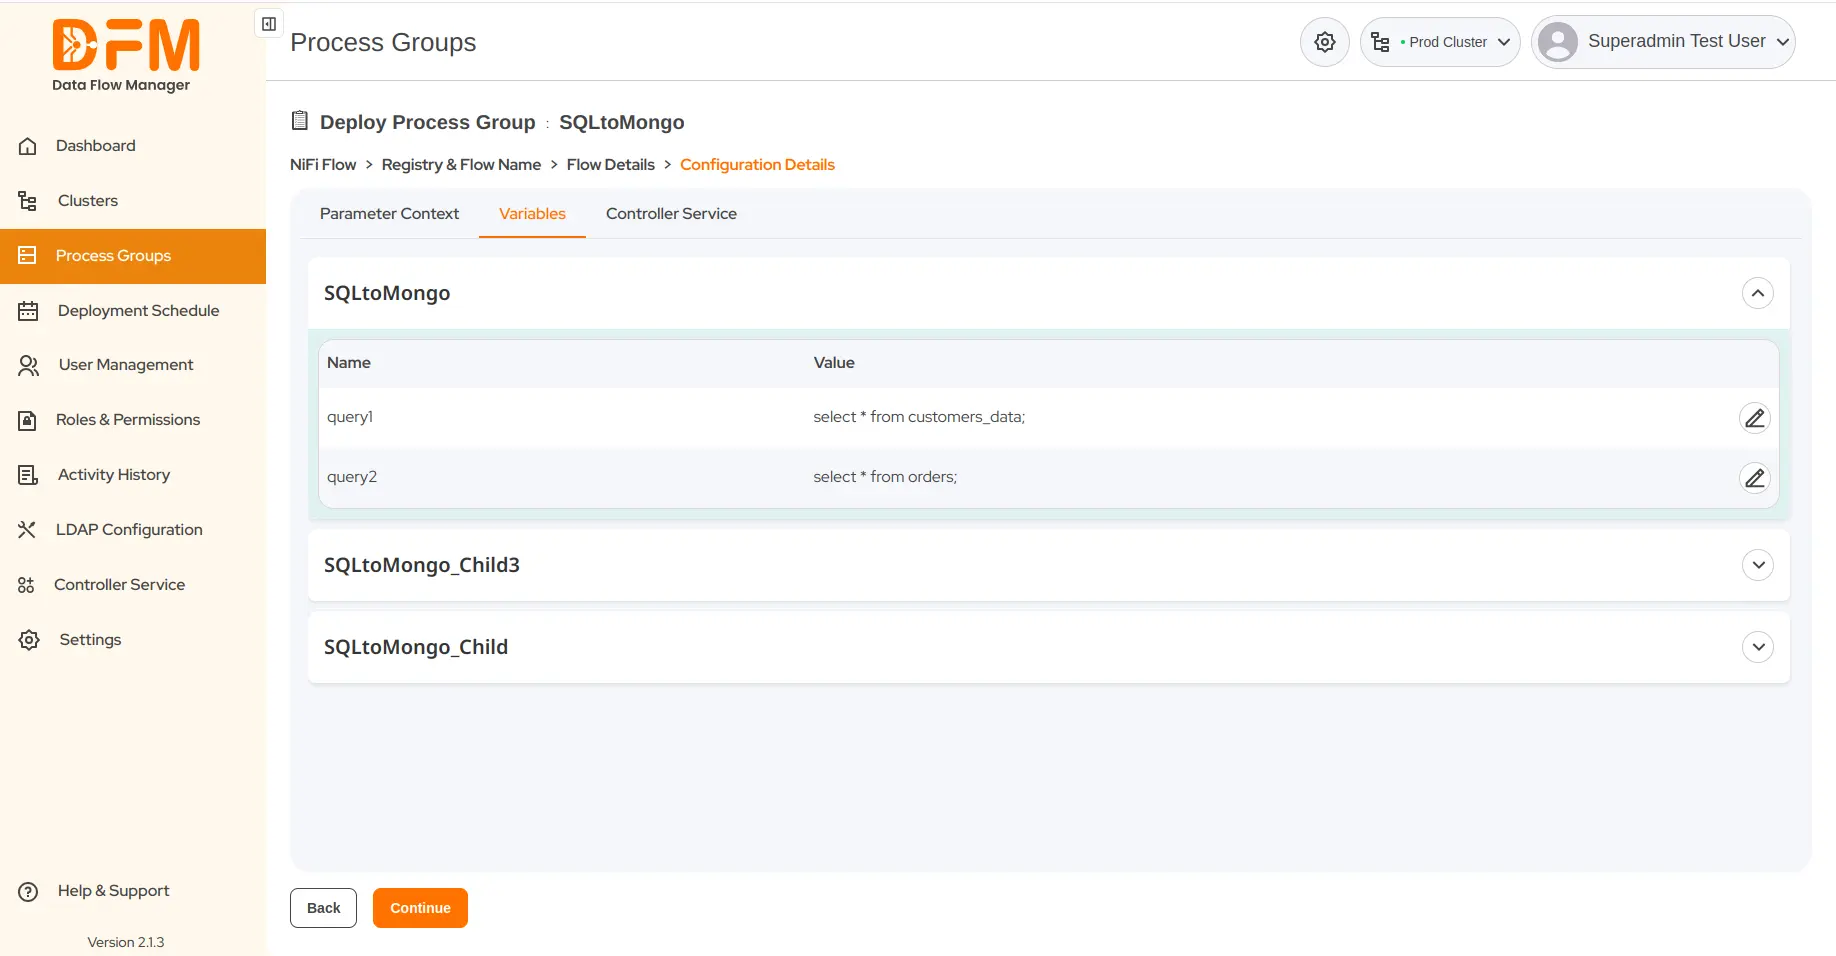
- Choose the one that you want to edit and click the edit icon.
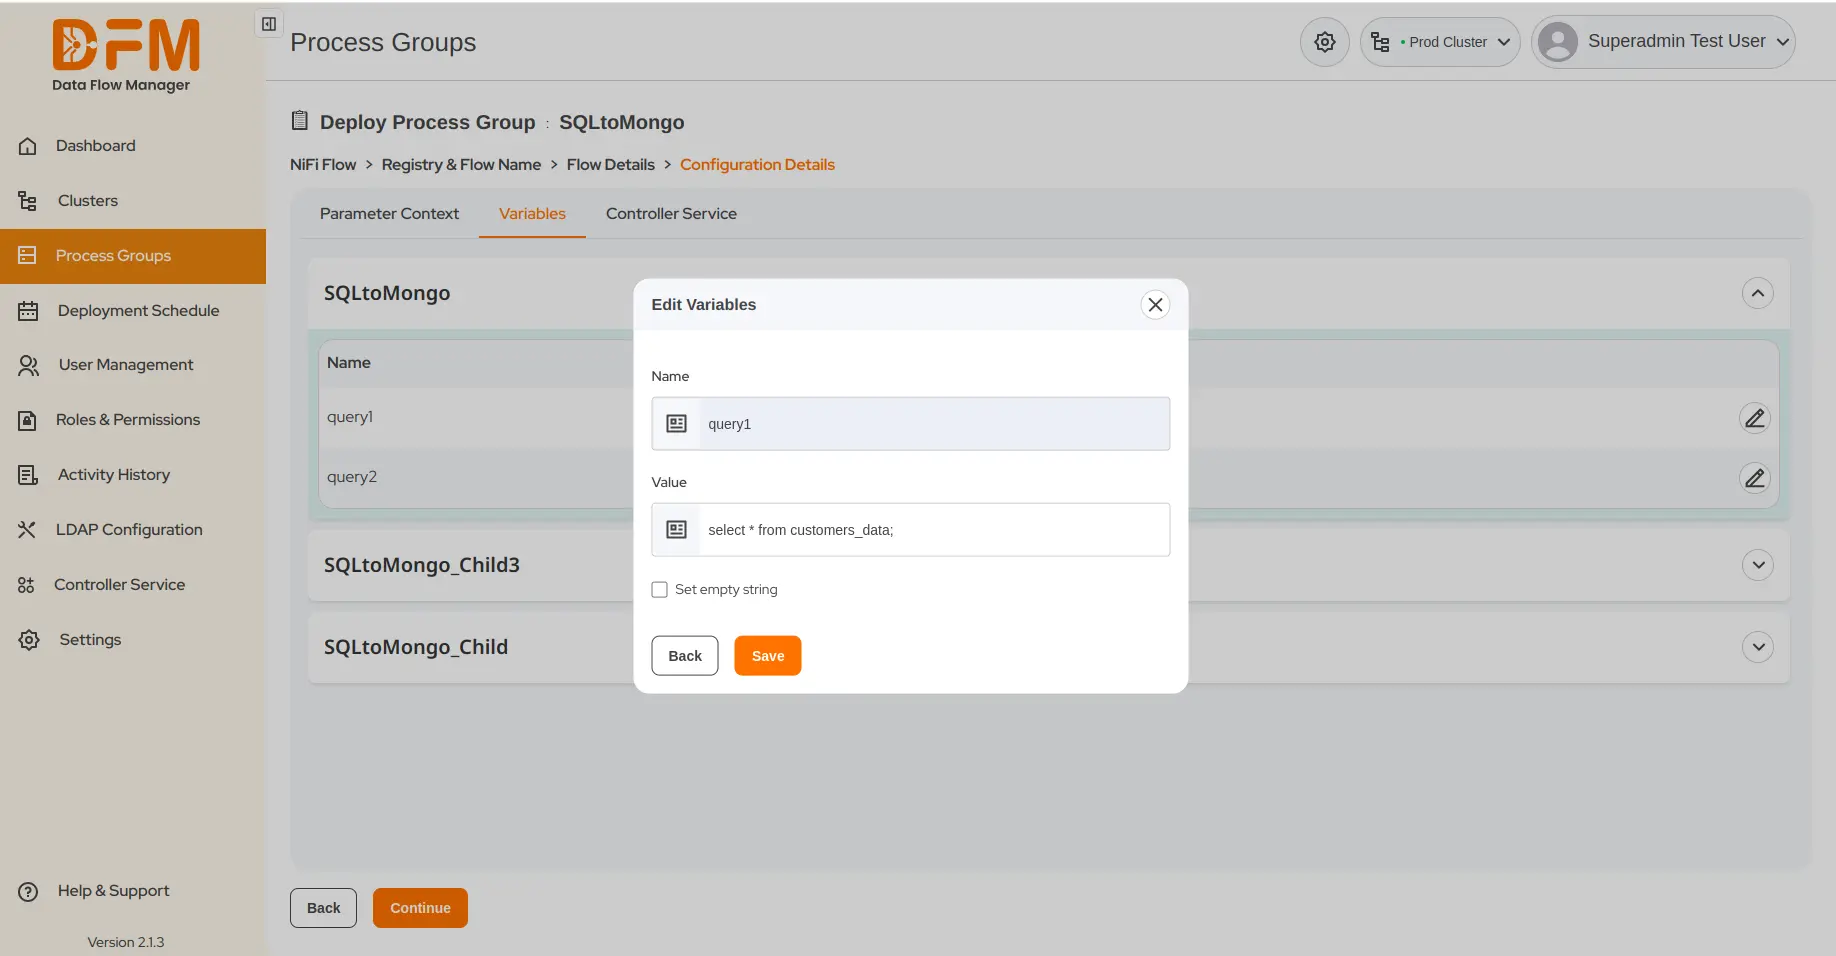
- Modify the value of the variables and click Save.
4.7. Configure local controller services for a process group while deploying or upgrading it
Along with parameter contexts and variables tabs, find the controller services tab. It lists all external and local controller services of a process group you’re deploying.
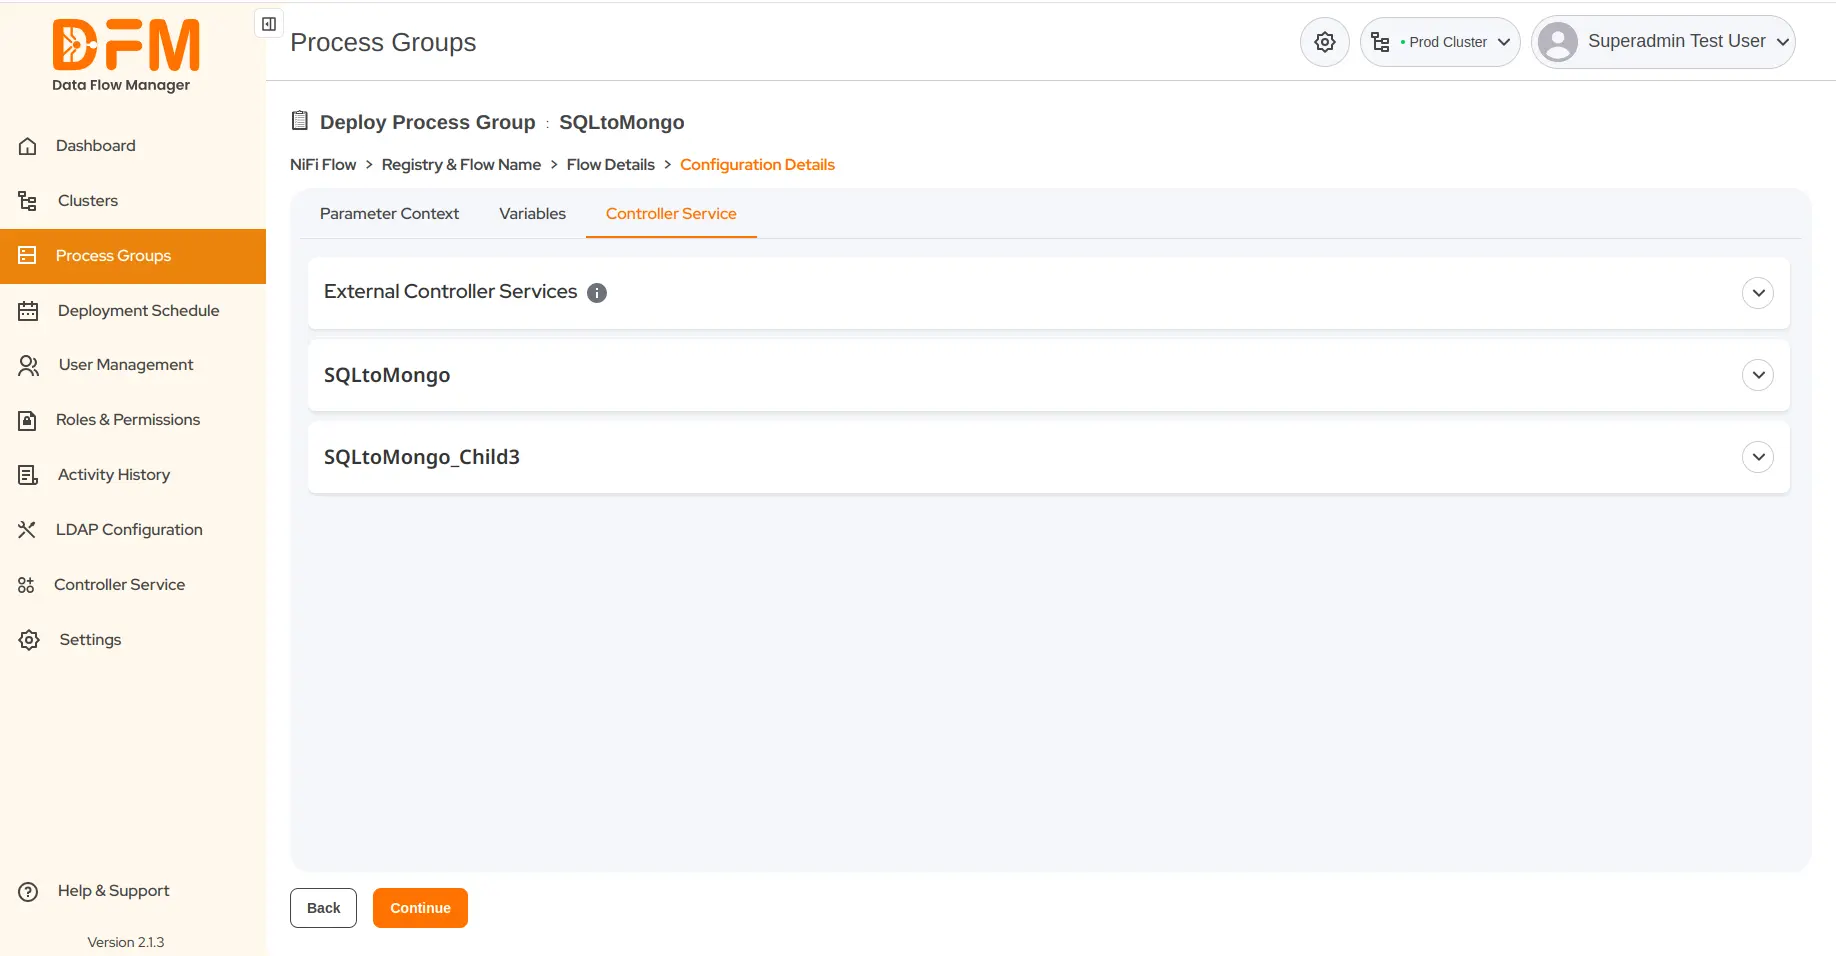
To configure the controller service local to the process group:
- Choose the local controller service and click the settings icon.
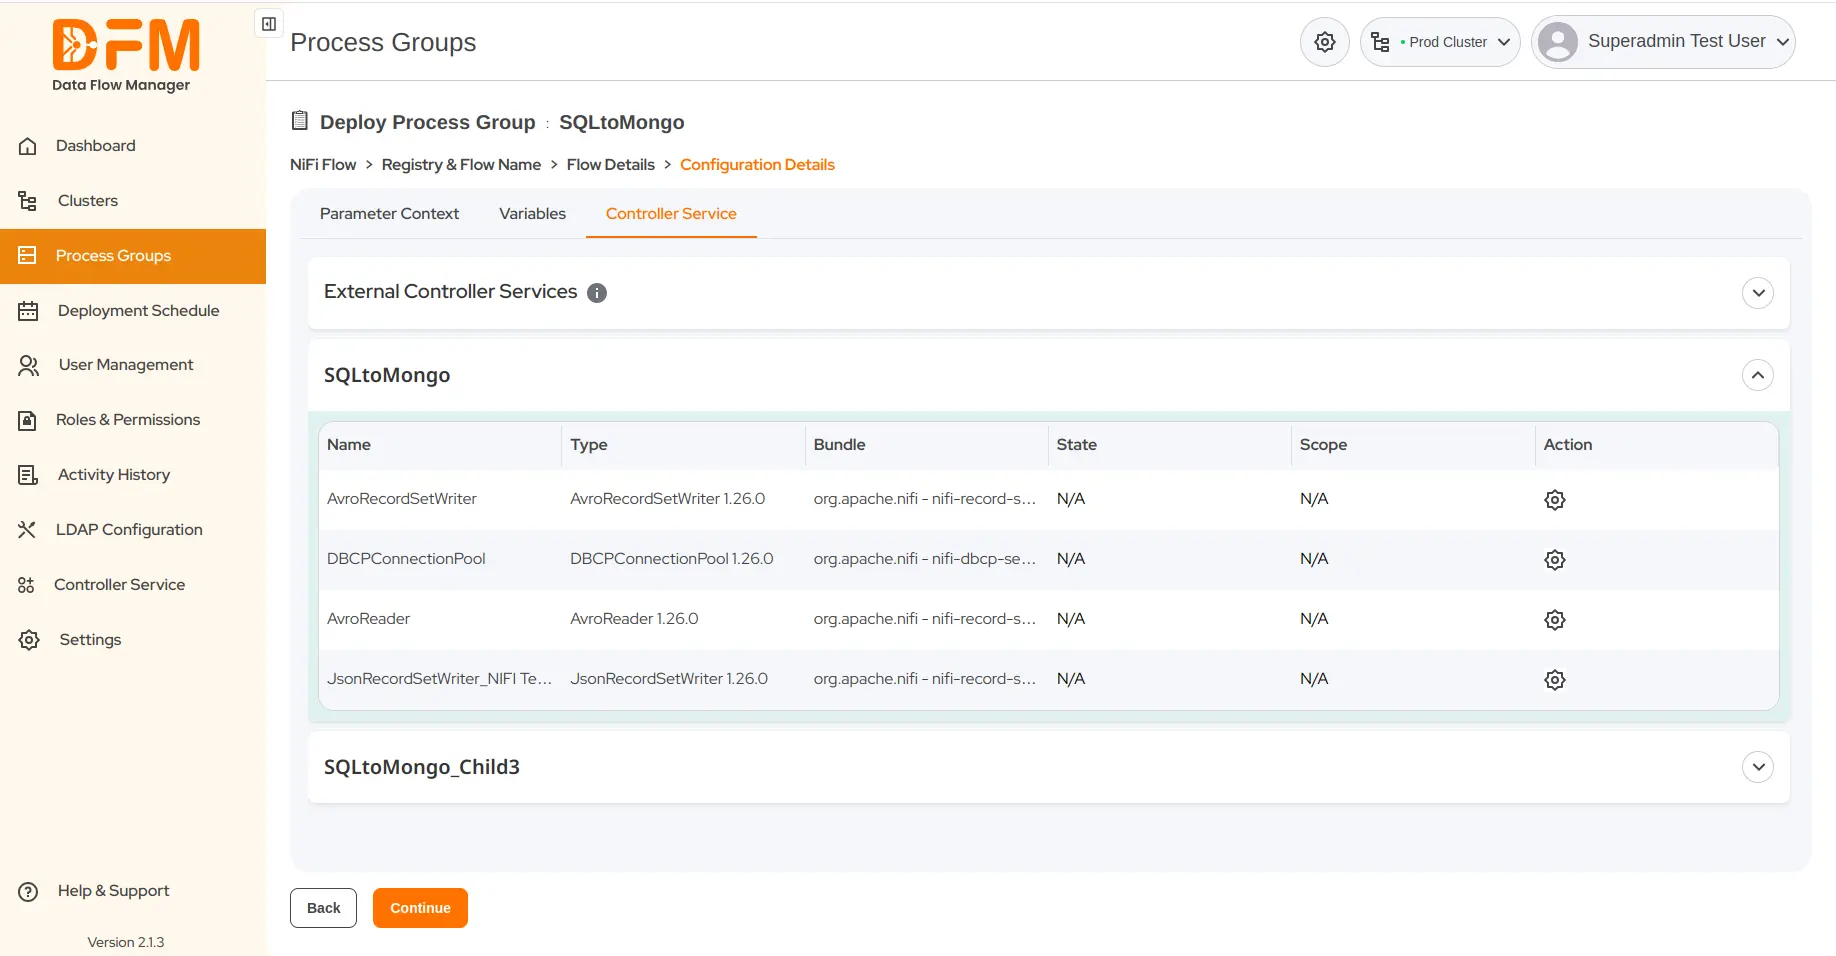
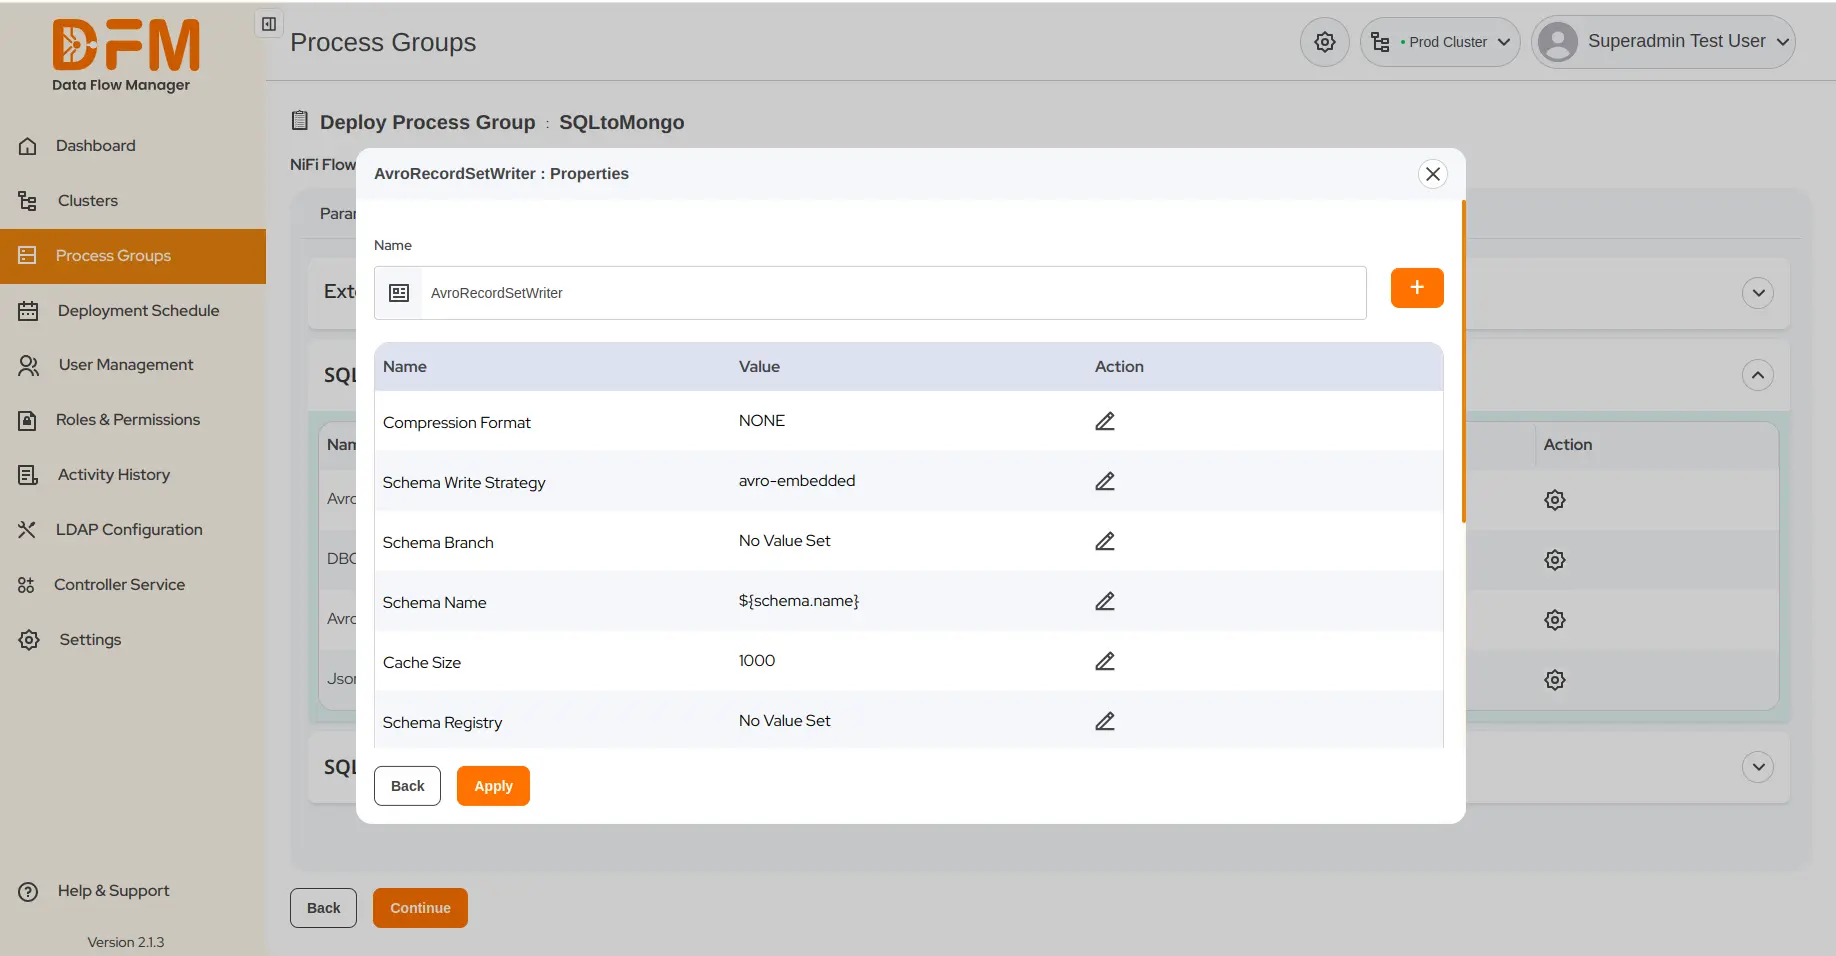
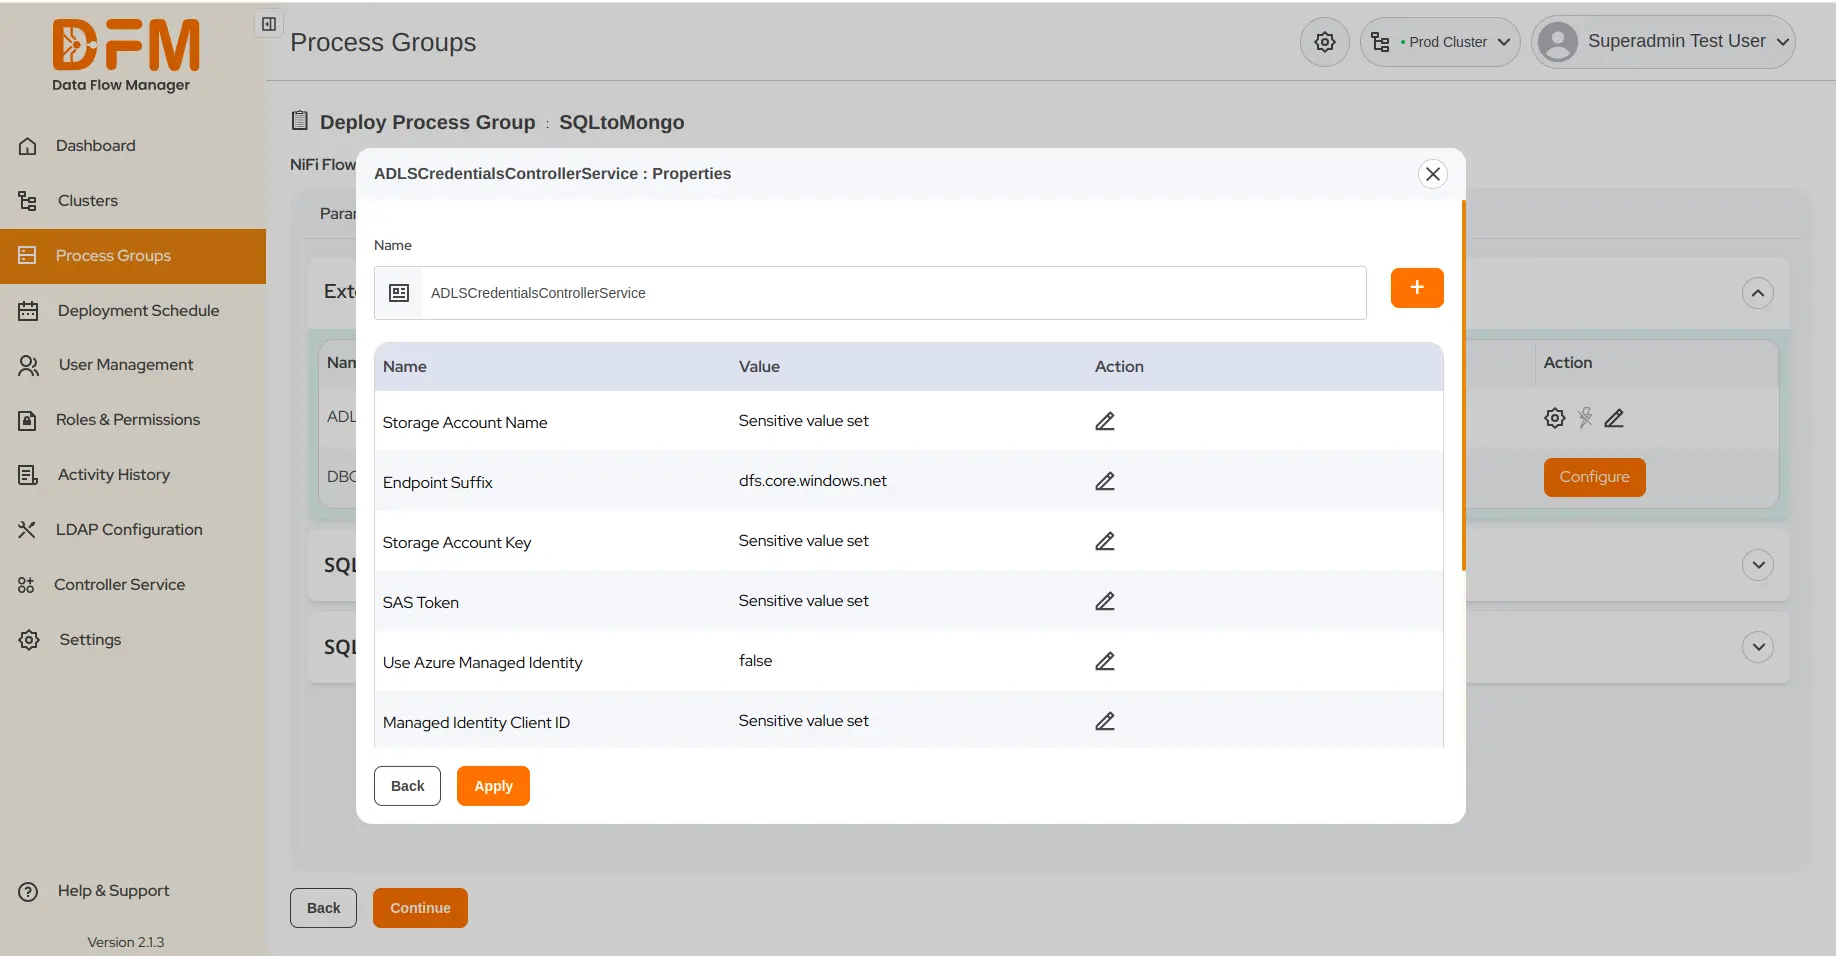
- You’ll see a list of properties with their names and values.

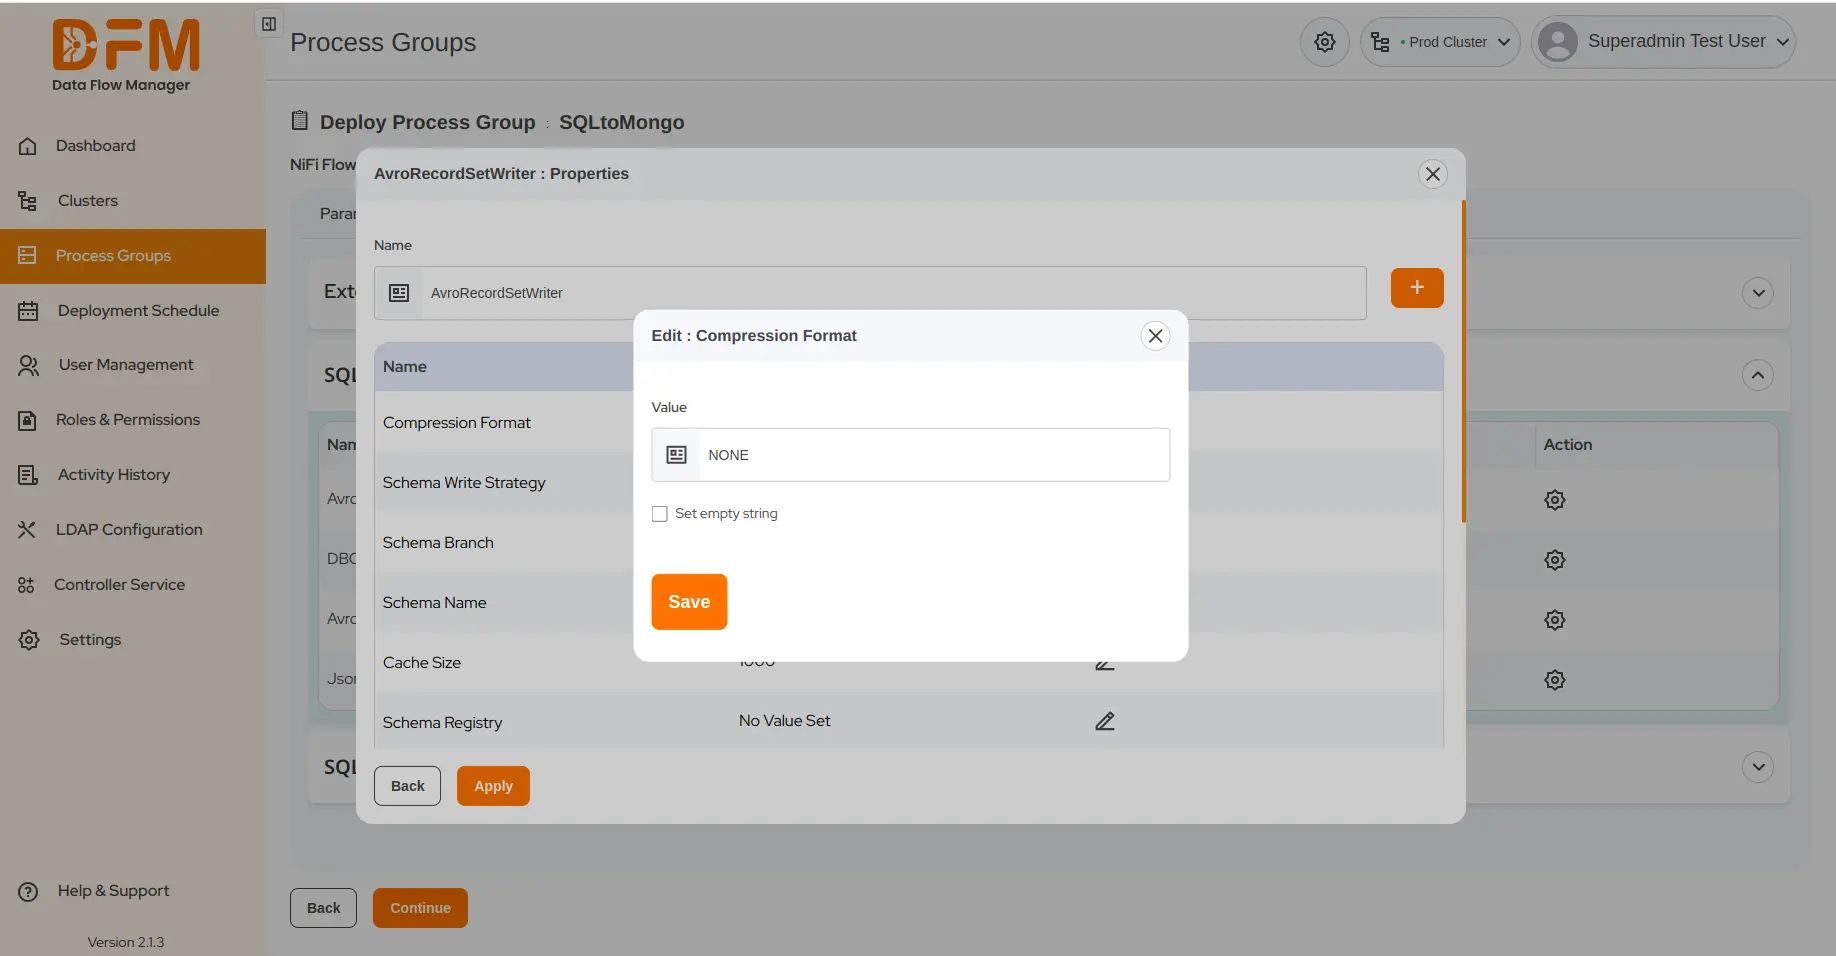
- Click the edit icon to change the value of properties. After changing the value, click Save.
- Once done, click Apply.
4.8. Attach an existing external controller service to a process group while deploying or upgrading it
Under the same controller service tab,
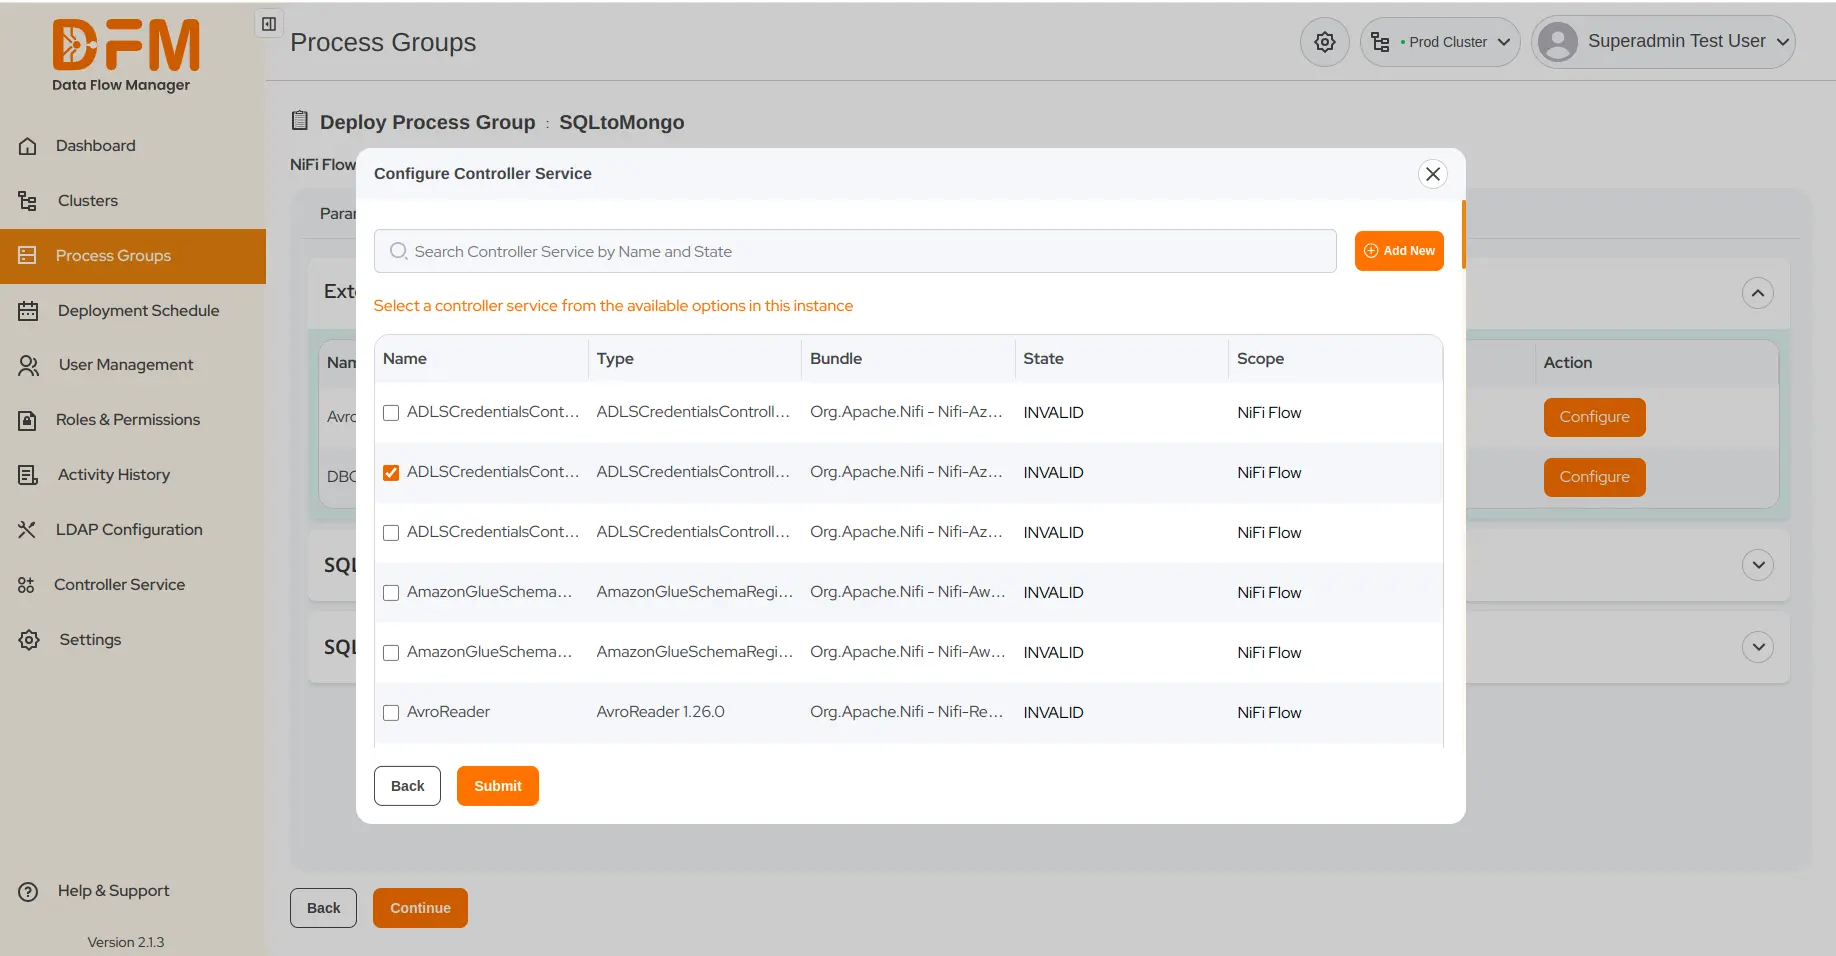
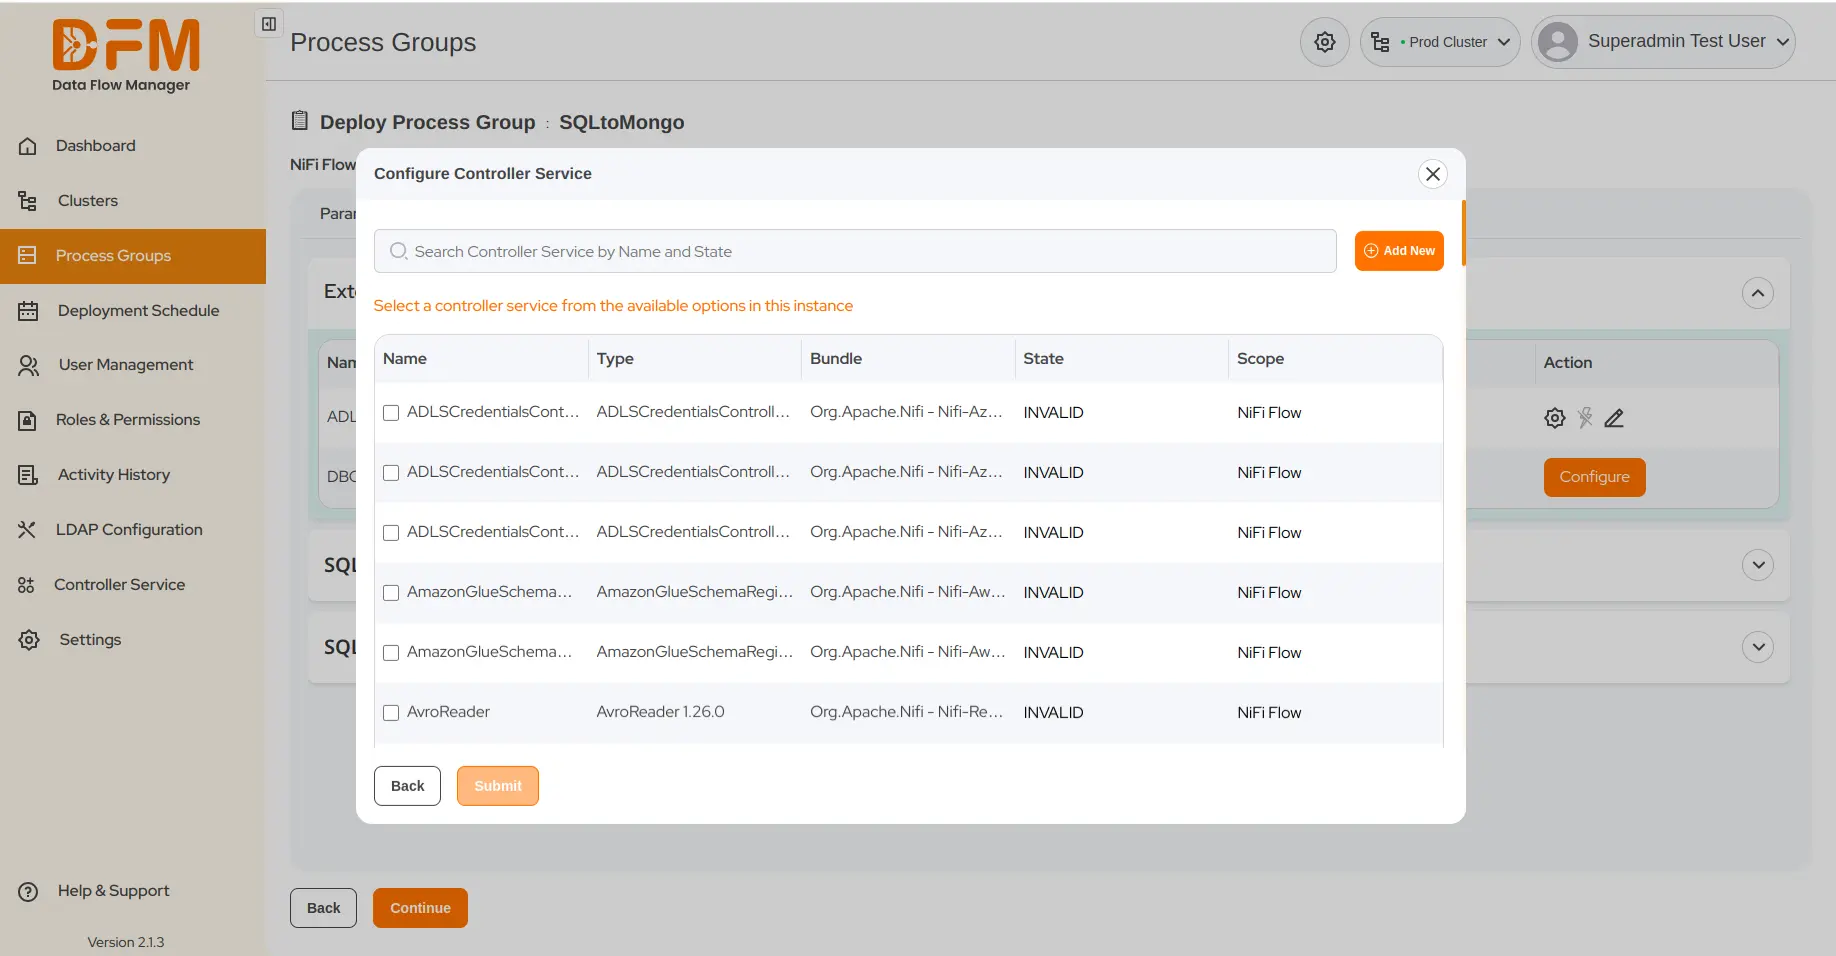
- Choose External Controller Services and click Configure.
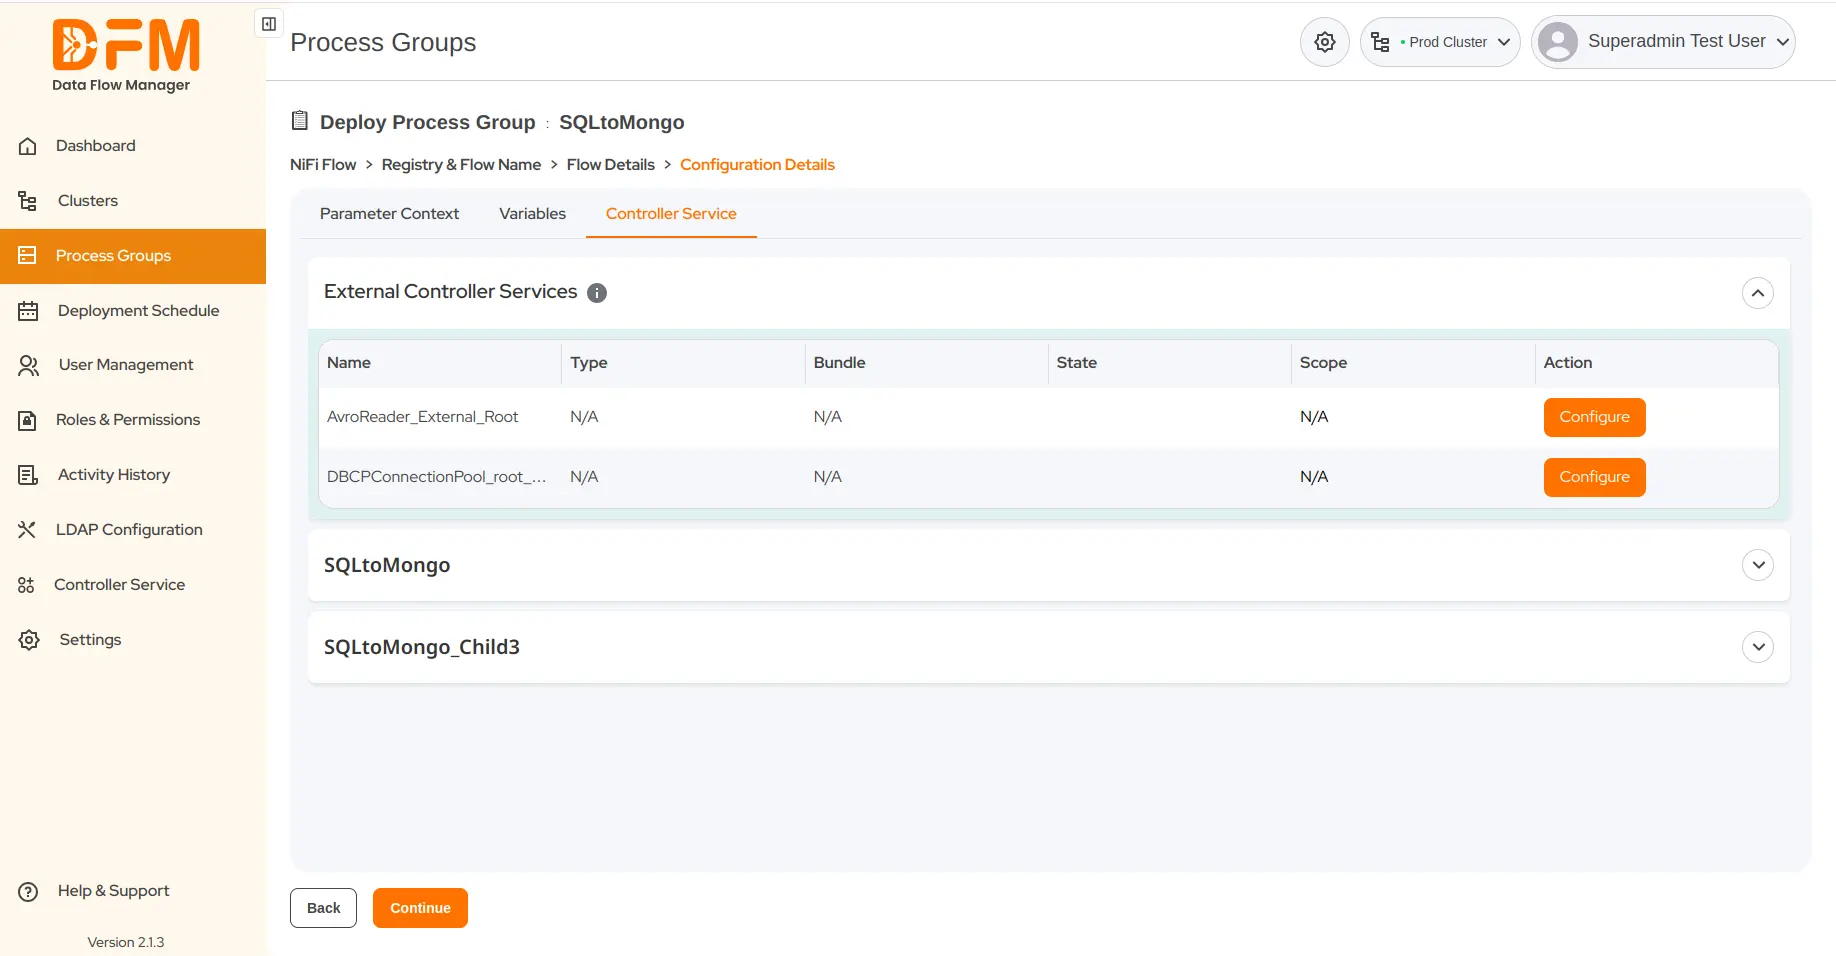
- A pop-up appears where you can select the controller service you want to attach. Search it by its name or state. Mark the check box and click Submit.
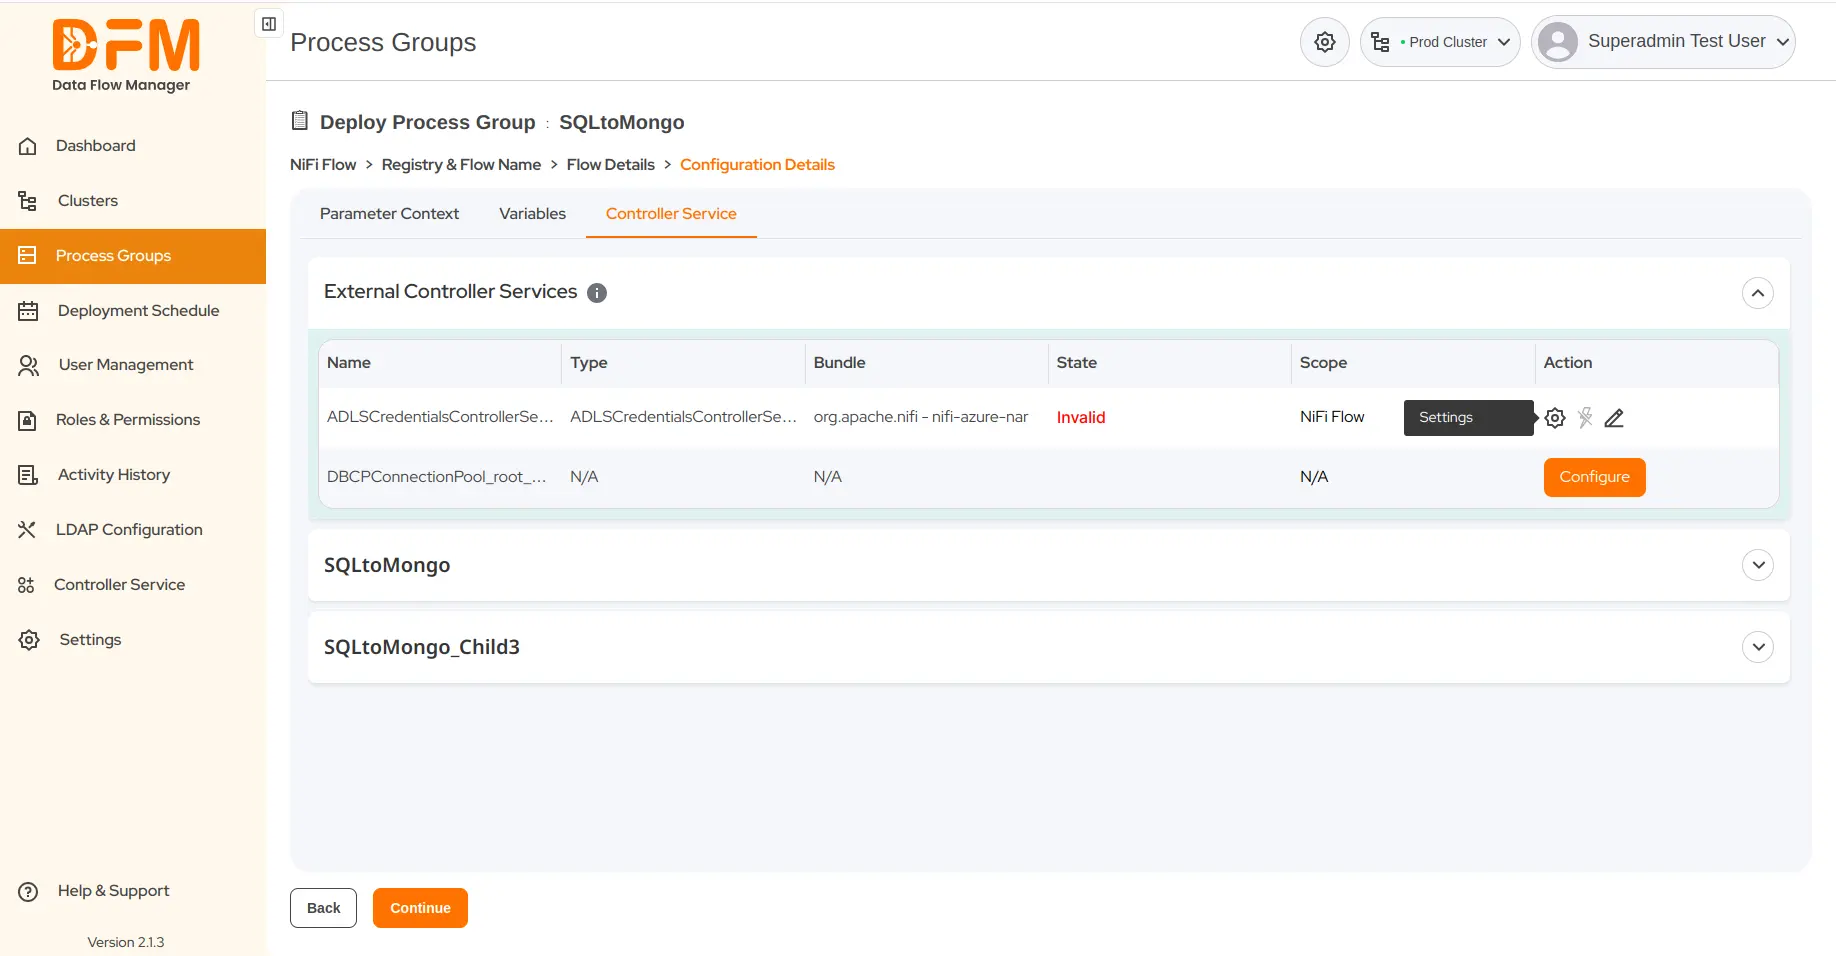
- Now, go to Settings located on the right side of the chosen controller service.
- Fill in the values of all the fields, and finally click Apply.
4.9. Add a new external controller service to a process group while deploying or upgrading it
Under the same Controller Service tab:
- Go to External Controller Services, and click on Configure.
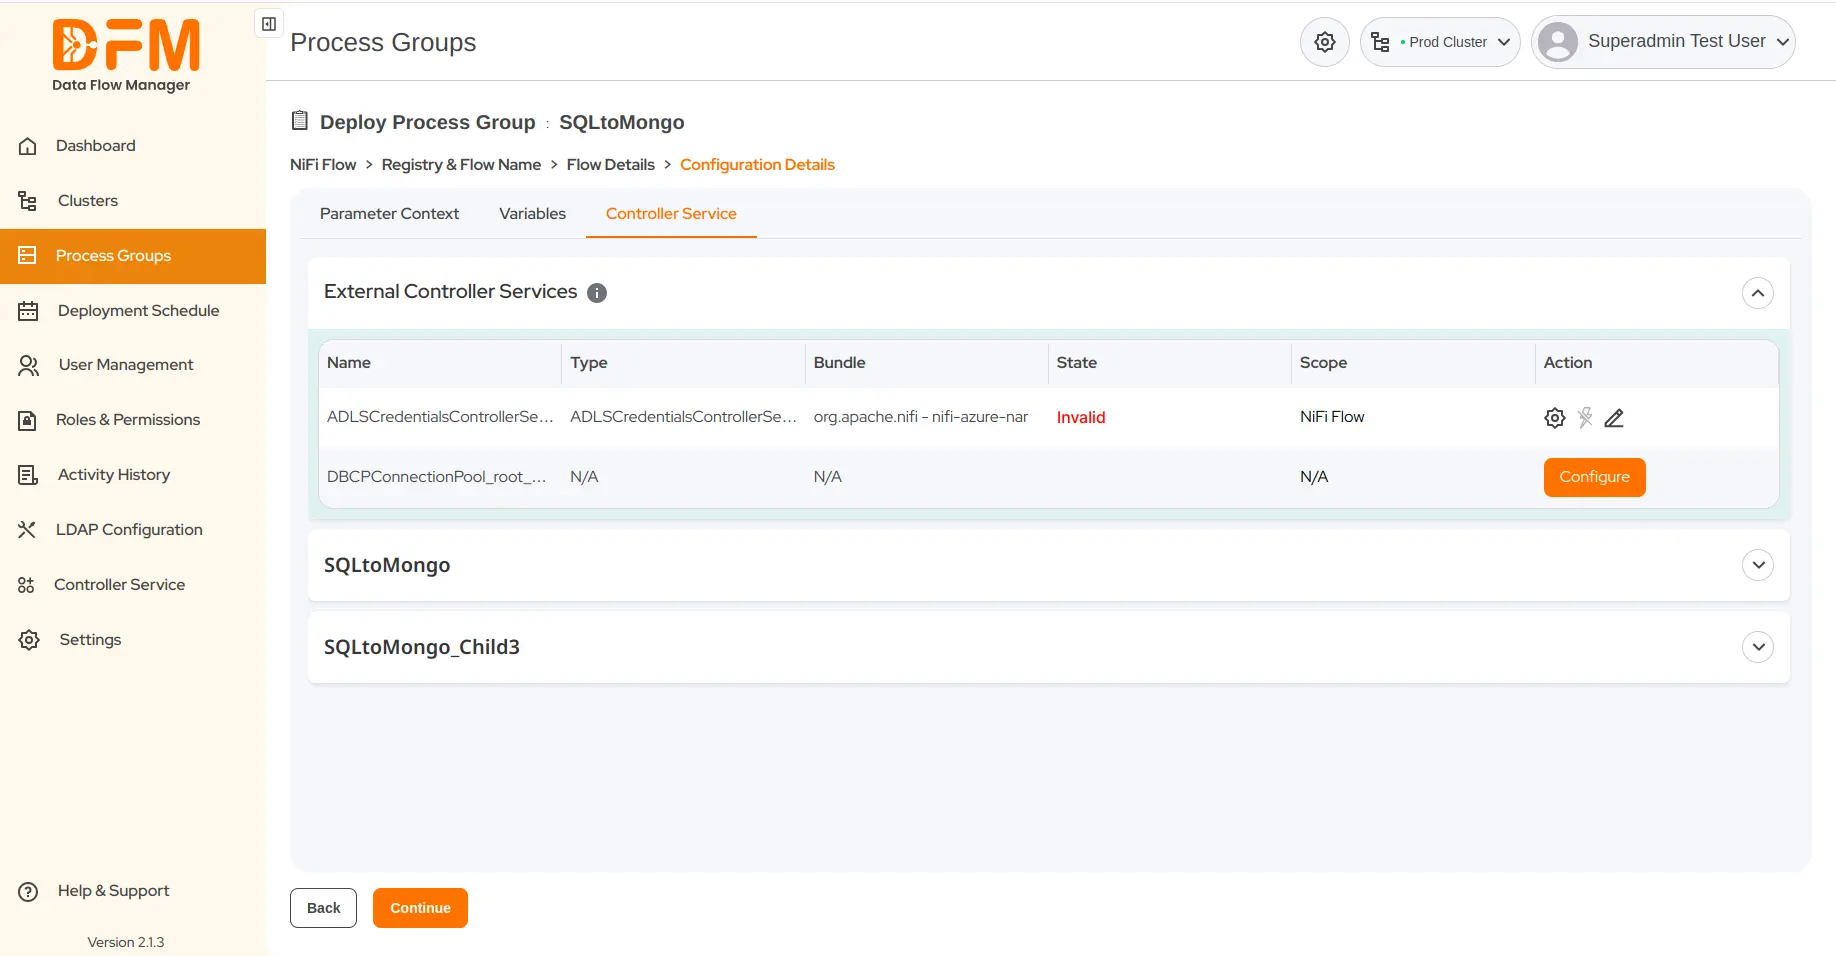
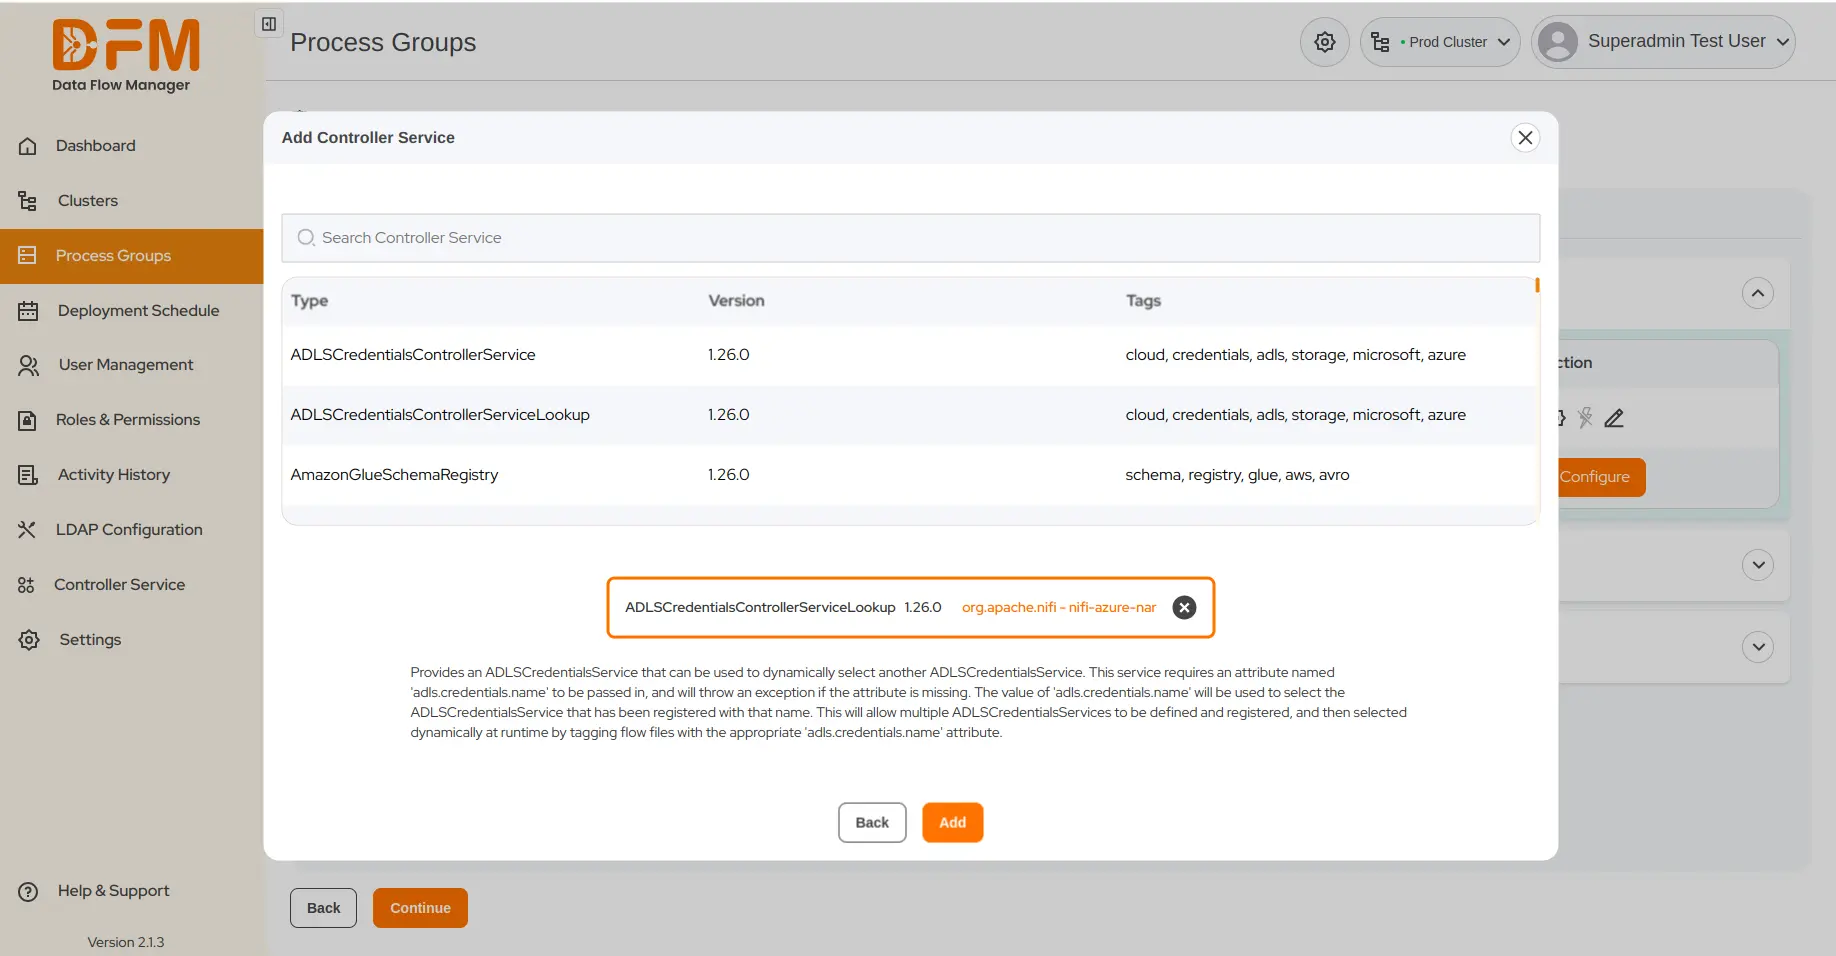
- A pop-up appears where you can find an option to add a new external controller service.
- Choose the external controller service from the given list and click Add.
5. Deployment Schedule
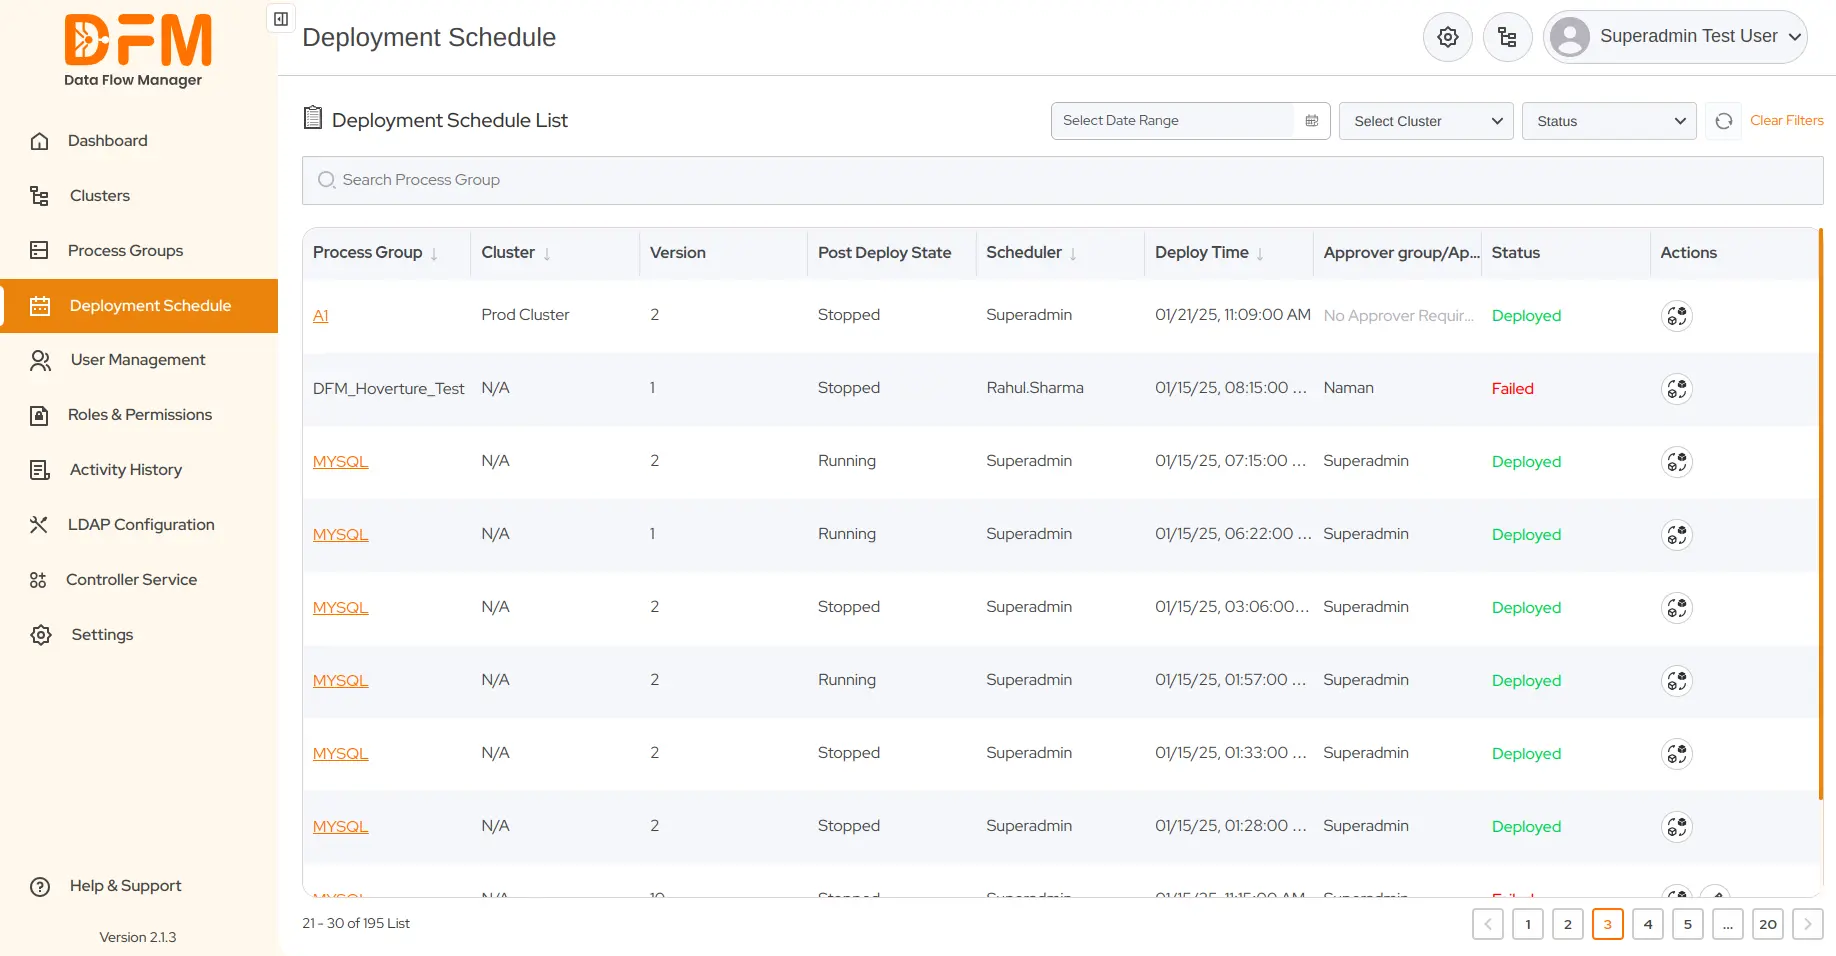
The Deployment Schedule tab lists all process groups scheduled for deployments or upgrades. You can view the key details for each process group, such as:
- Cluster name: The cluster containing the process group.
- Flow version: The version of the process group scheduled for deployment or upgrade.
- Post-deploy state: It indicates whether the flow is running or stopped.
- Scheduler: The role of a person who scheduled the deployment or upgrade.
- Deploy time: The time at which the deployment or upgrade is scheduled.
- Approver: The role of a person who approved the deployment or upgrade.
- Status: It indicates the status of the scheduled process groups, such as Approved, Not Approved, Failed, Pending, Rejected, Stopped, and Time Lapsed.
- Actions: Provides information about the process group’s parameter contexts, variables, and controller services.
Moreover, you can search any process group by entering its name in the search bar given.
5.1. Filter the list of process groups scheduled for deployment
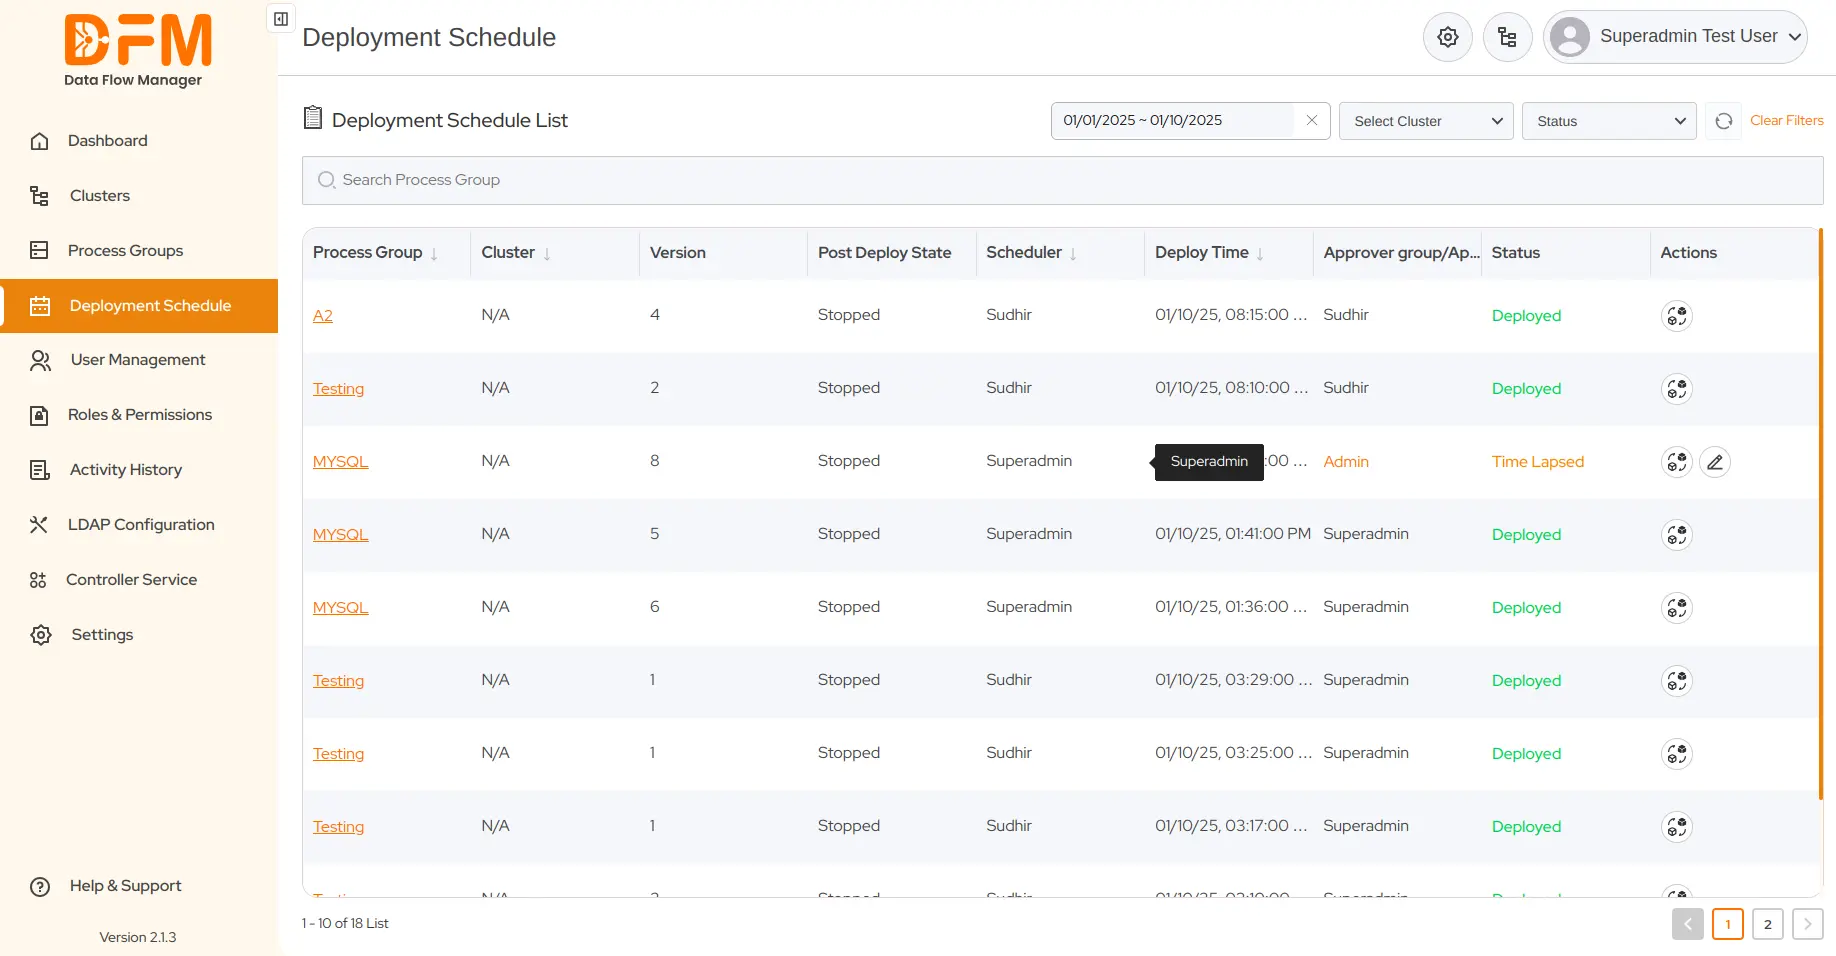
You can filter the list of process groups scheduled for deployment based on the deployment date, cluster, and deployment status.
Under the Scheduled Deployment tab:
- Click on Select Date Range.
- Choose the date range (for instance, 1 January 2025 to 10 January 2025).
- Hit Ok.
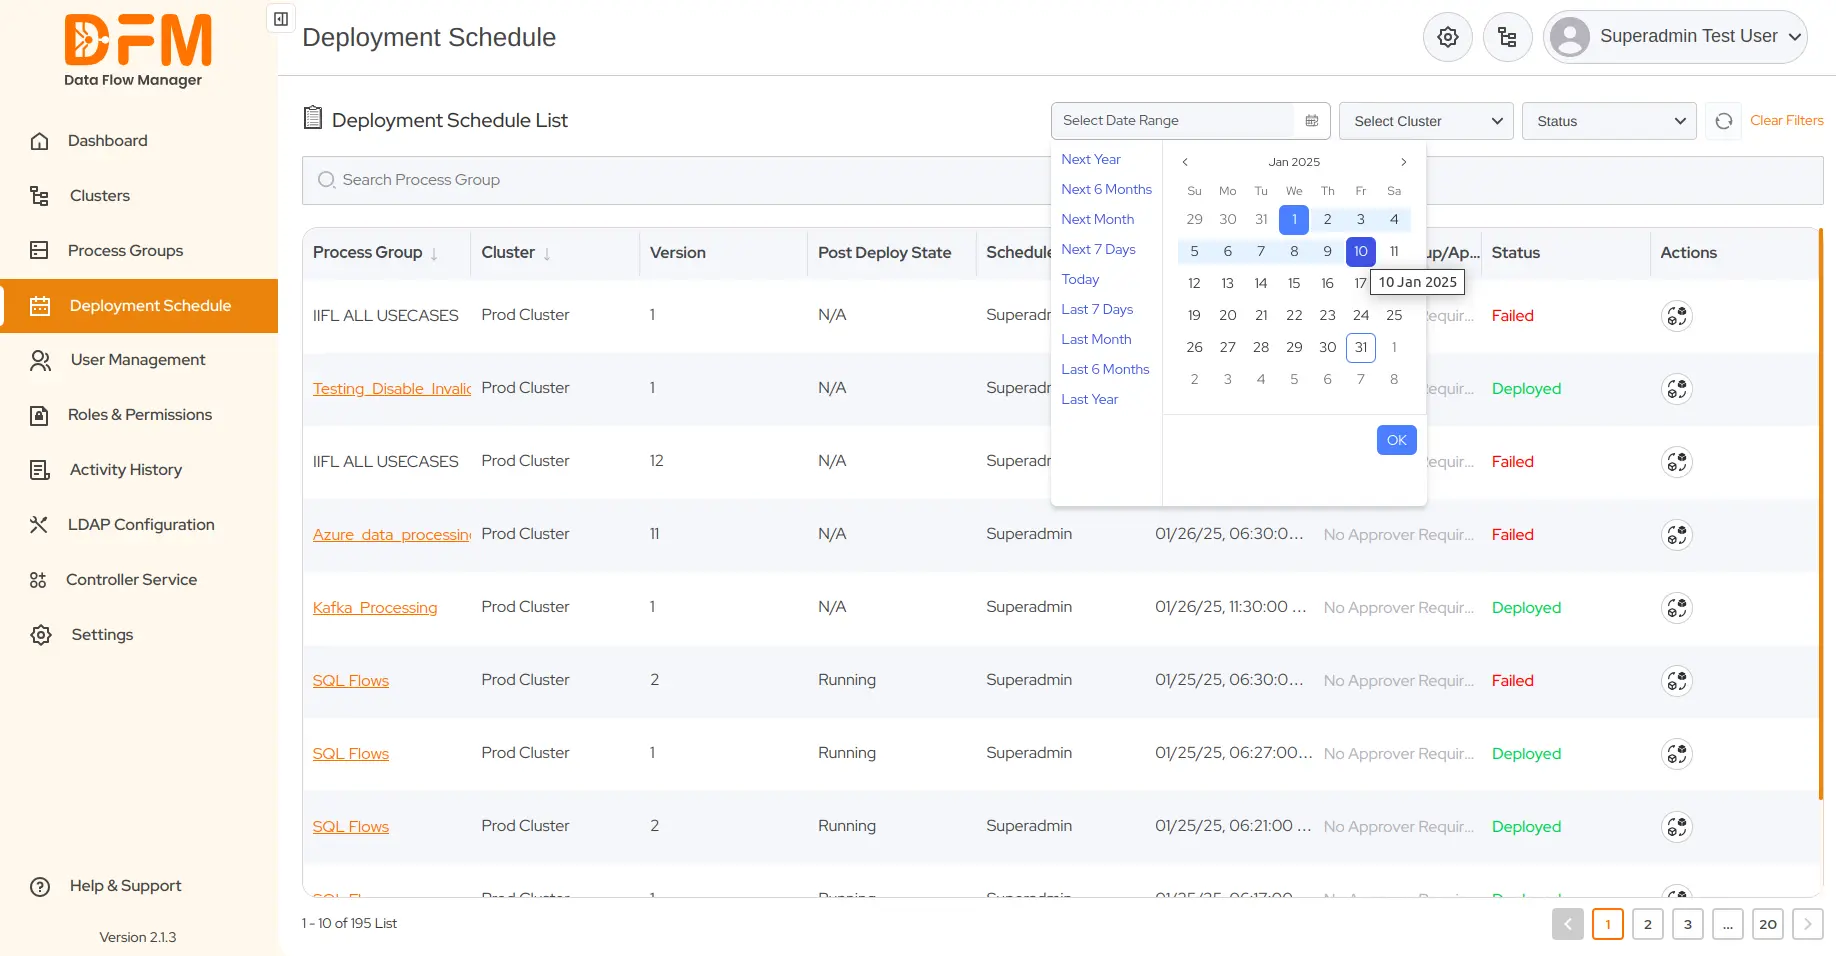
The list of process groups scheduled for deployment during the specified date range will appear.
On the same tab:
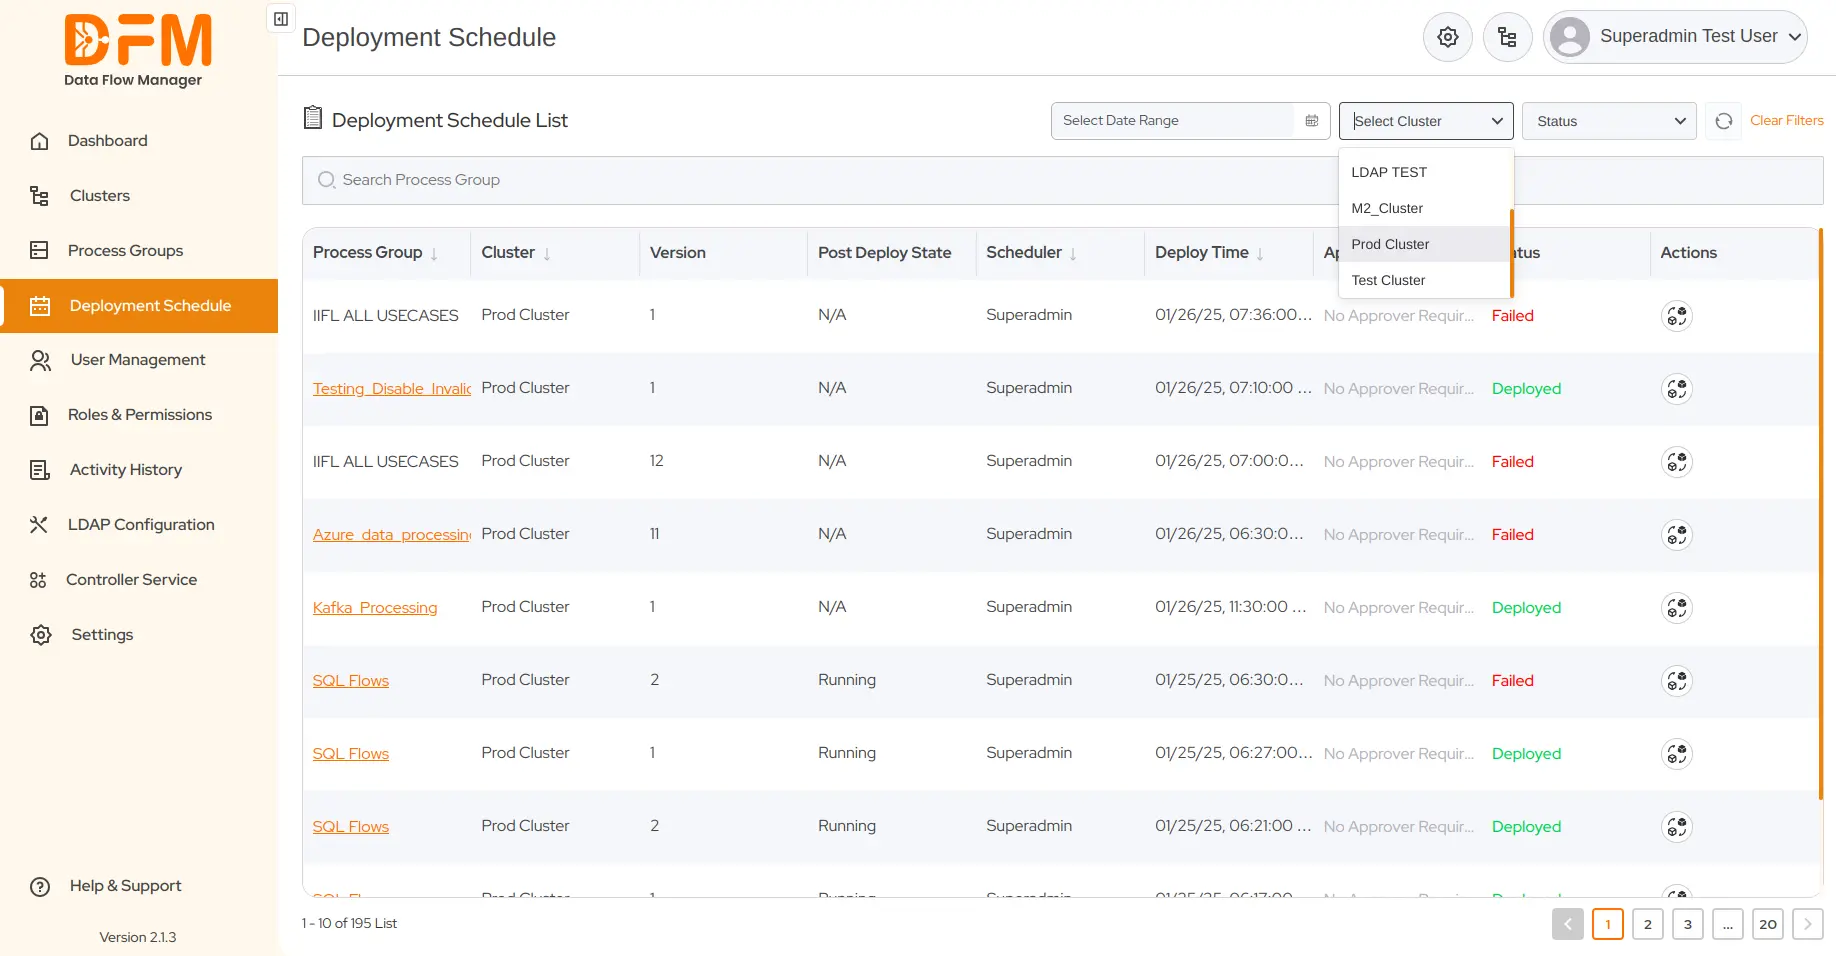
- Go to the Select Cluster dropdown present in the top-right corner.
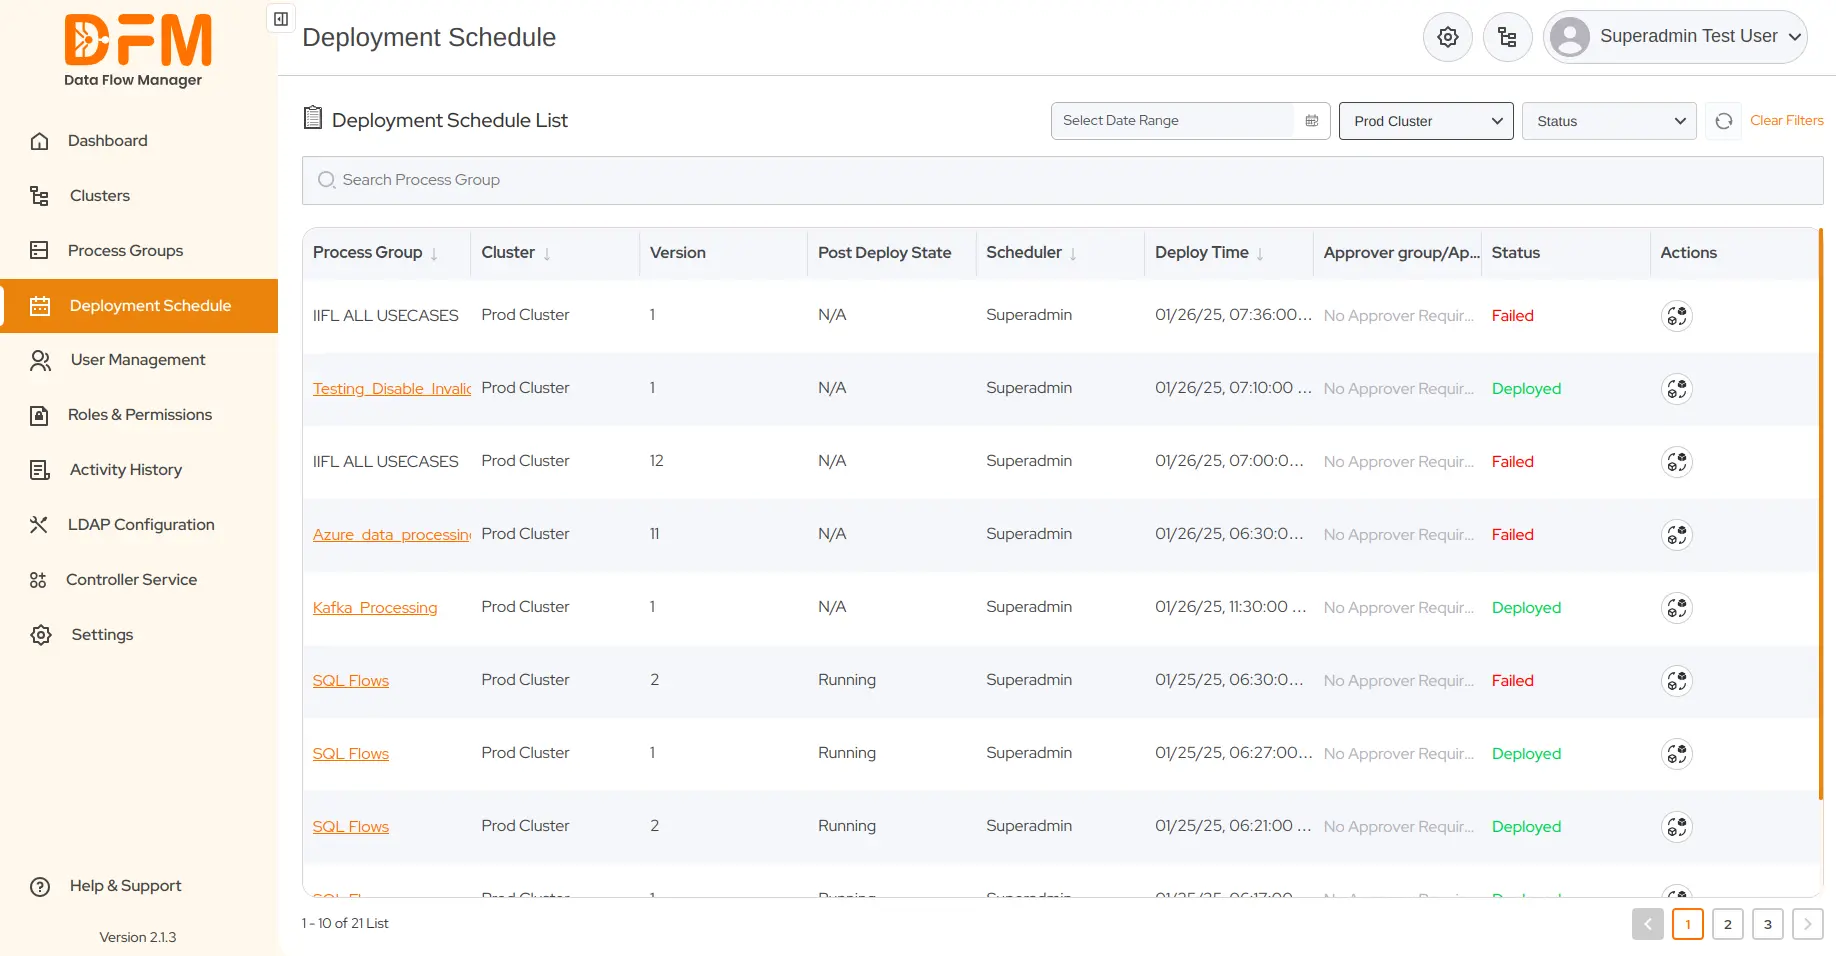
- Select the cluster whose process groups you want to display. We have chosen ProdCluster.
- The entire list of process groups in that cluster appears.
To filter the process group list based on the deployment status:
- Go to the dropdown named Status in the top-right corner of the Deployment Schedule tab.
- Choose one from the deployment status – Approved, Not Approved, Failed, Pending, Rejected, Stopped, and Time Lapsed.
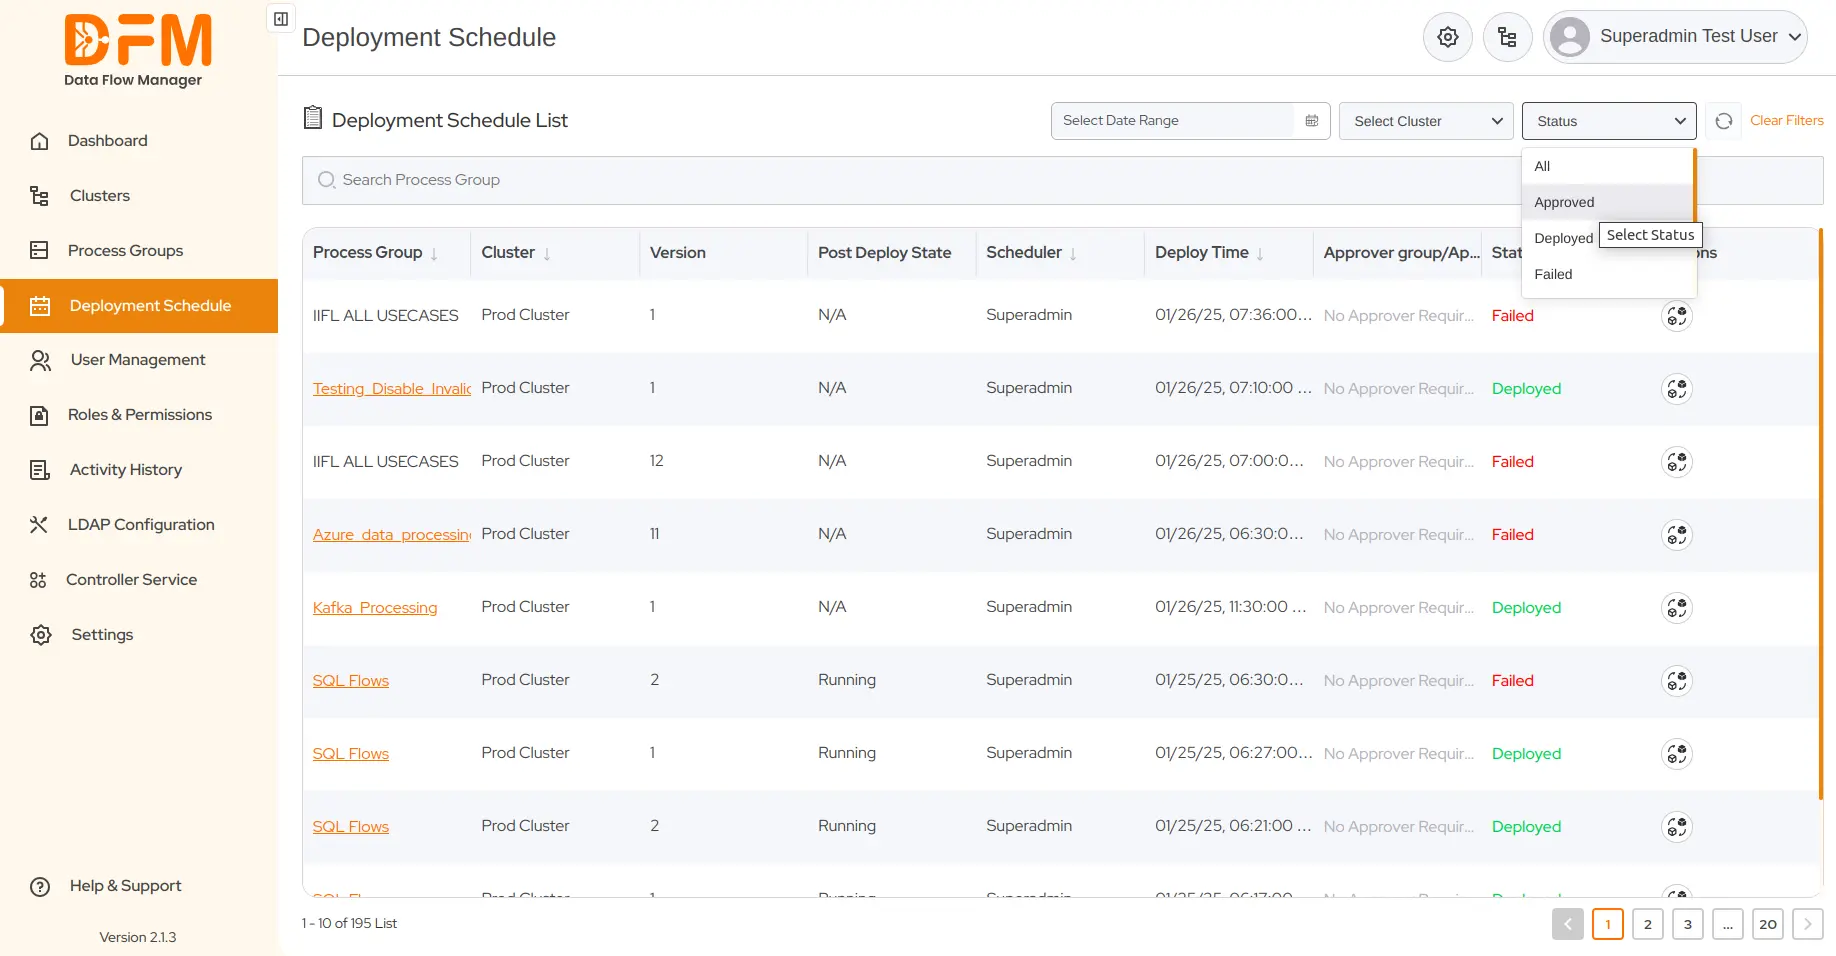
- Here, we’ve chosen the Approved status.
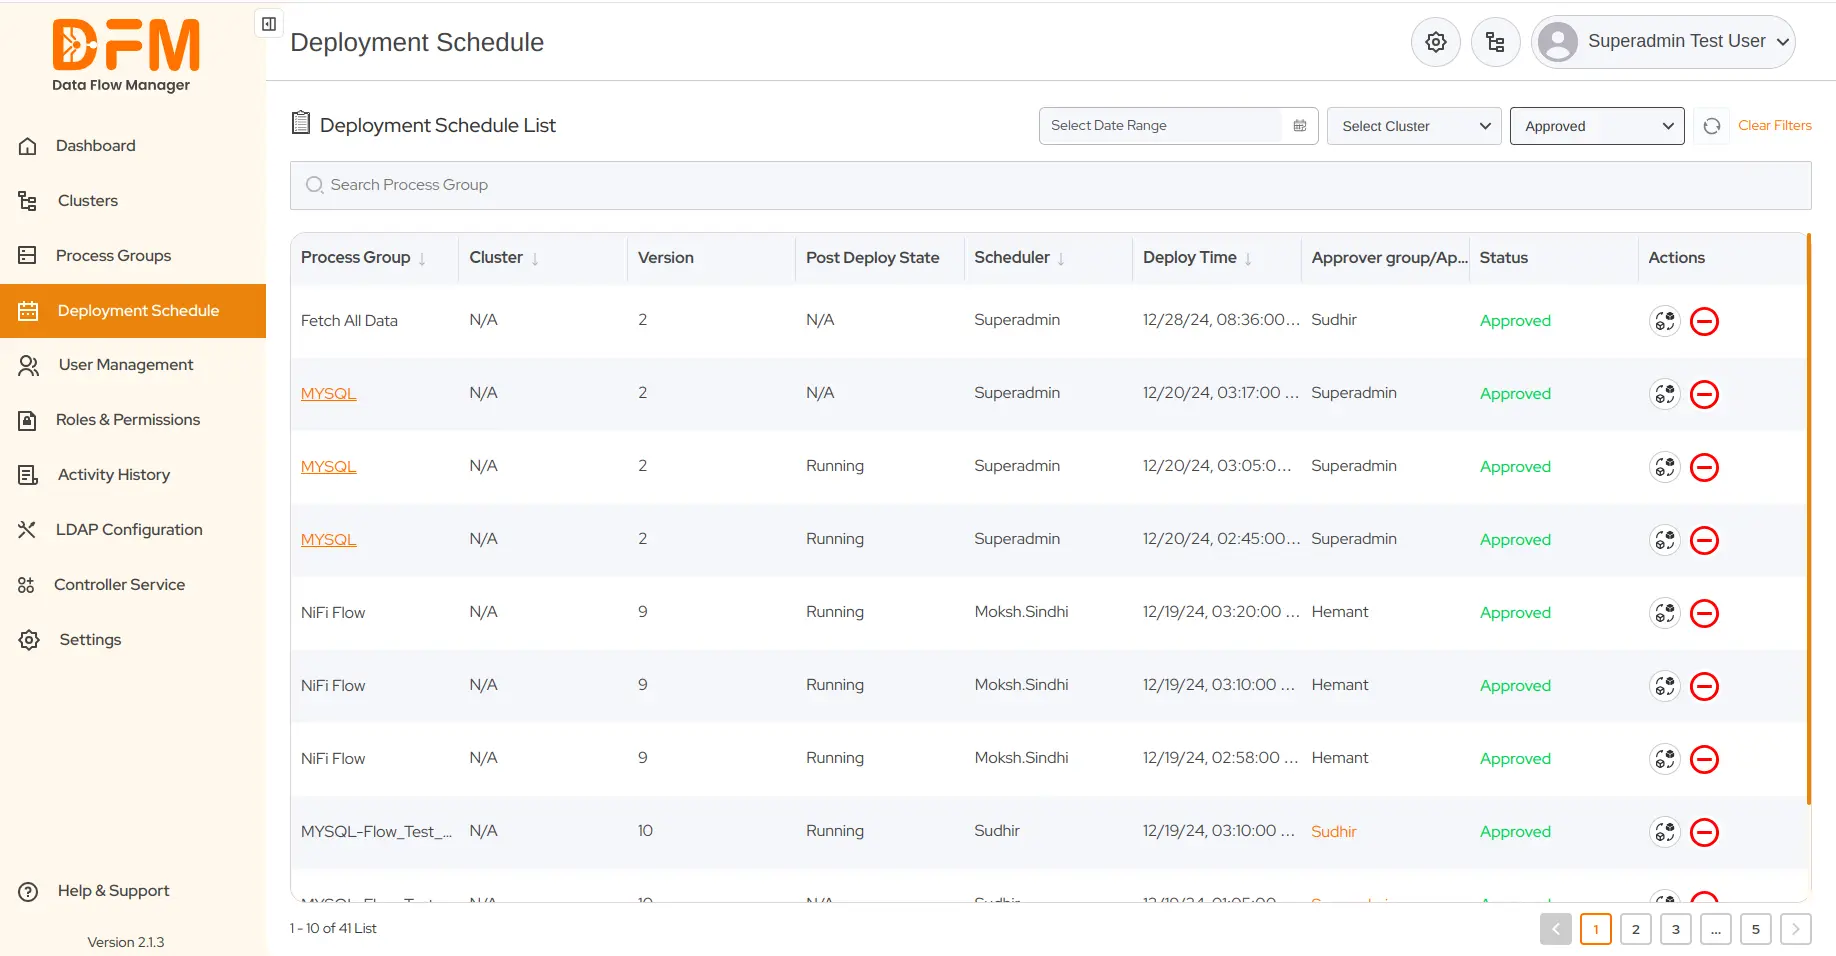
Note: You can use all three filters simultaneously to narrow down your search. Ensure to clear the filter every time when you use it so that you can apply another filter.
6. User Management
The User Management section contains a list of users, along with details like name, username, email, role, and status, that are synchronized with LDAP.
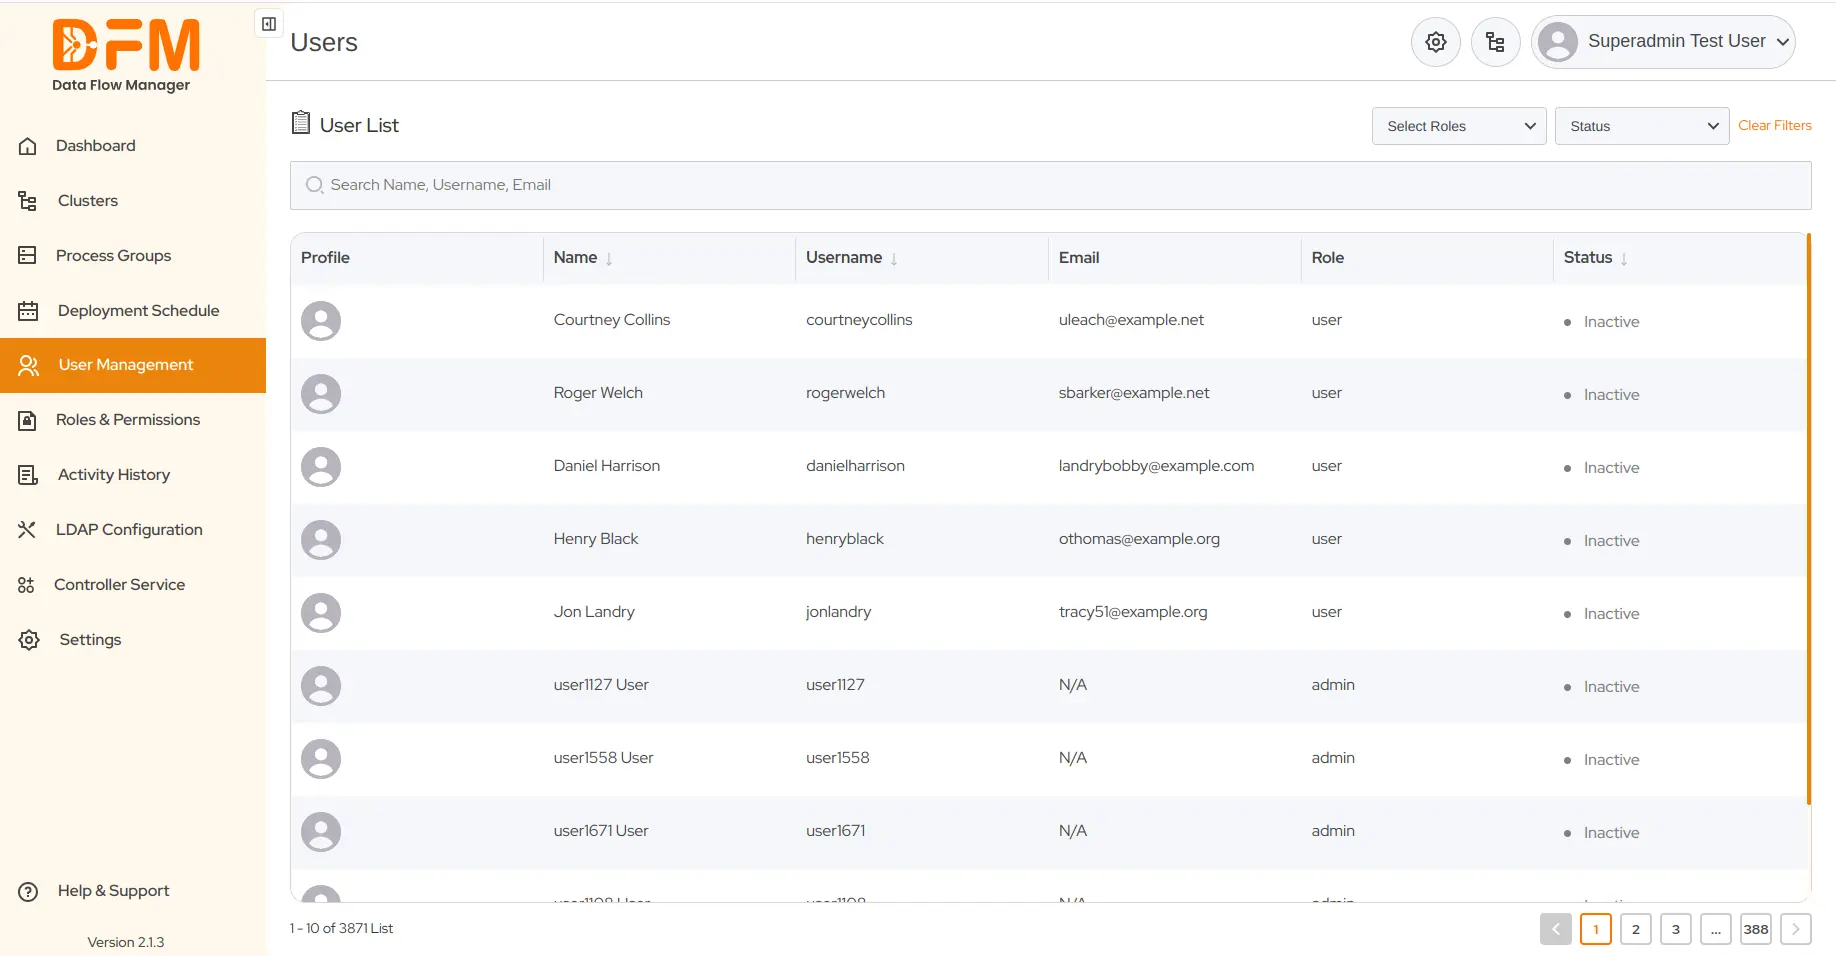
You can search for any user by entering their name, username, and email address. Additionally, you can leverage filters to sort the user list based on
User Role
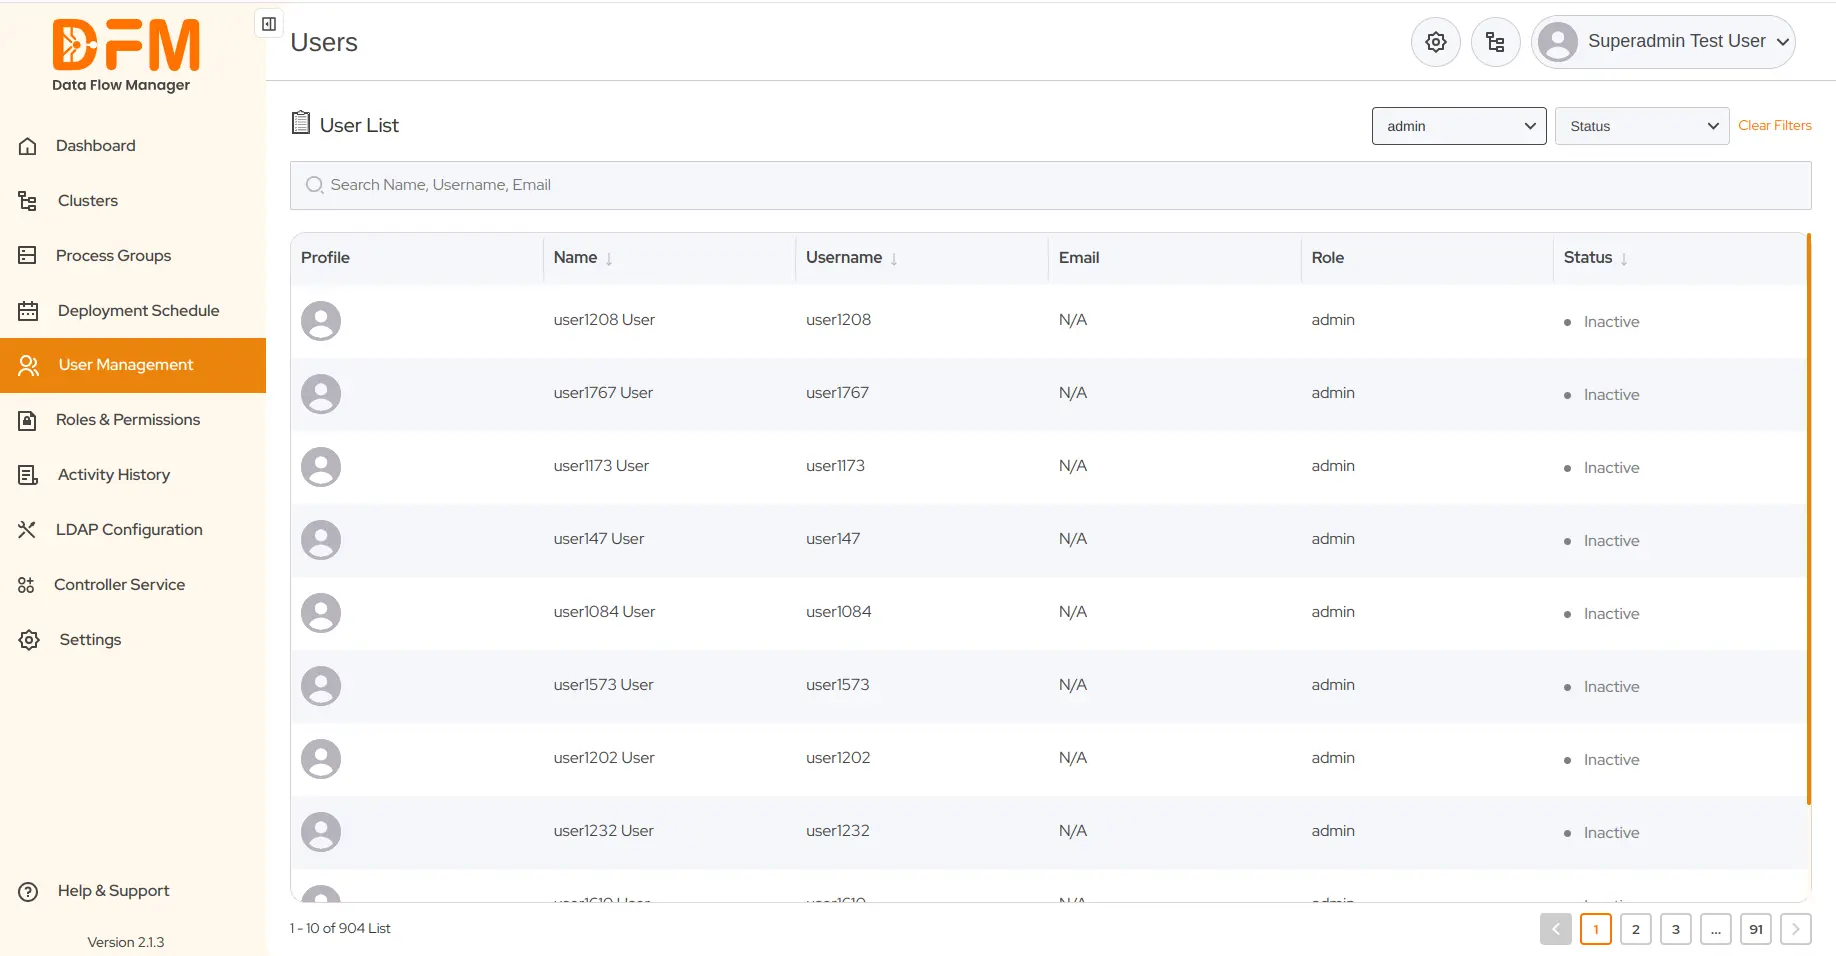
Status (Active & Inactive)

7. Roles and Permissions
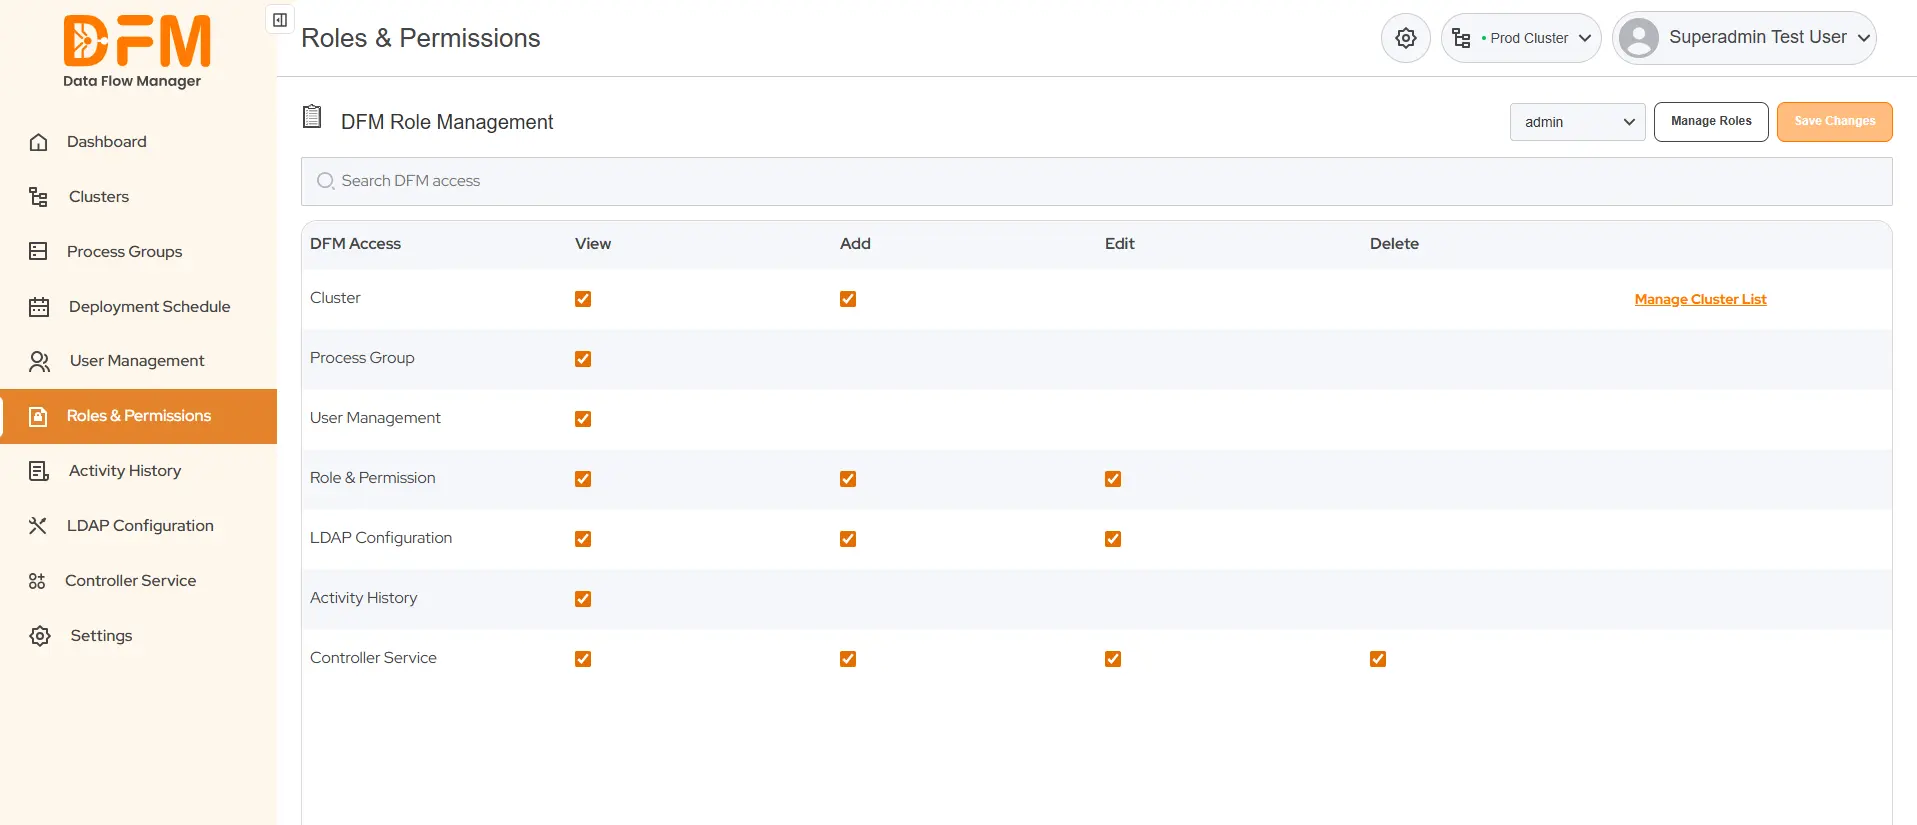
Create new roles and assign different roles and permissions to users, ensuring that they have appropriate read or write access to Data Flow Manager’s certain menus as well as clusters.
7.1. Add a new user role
To add a new user role:
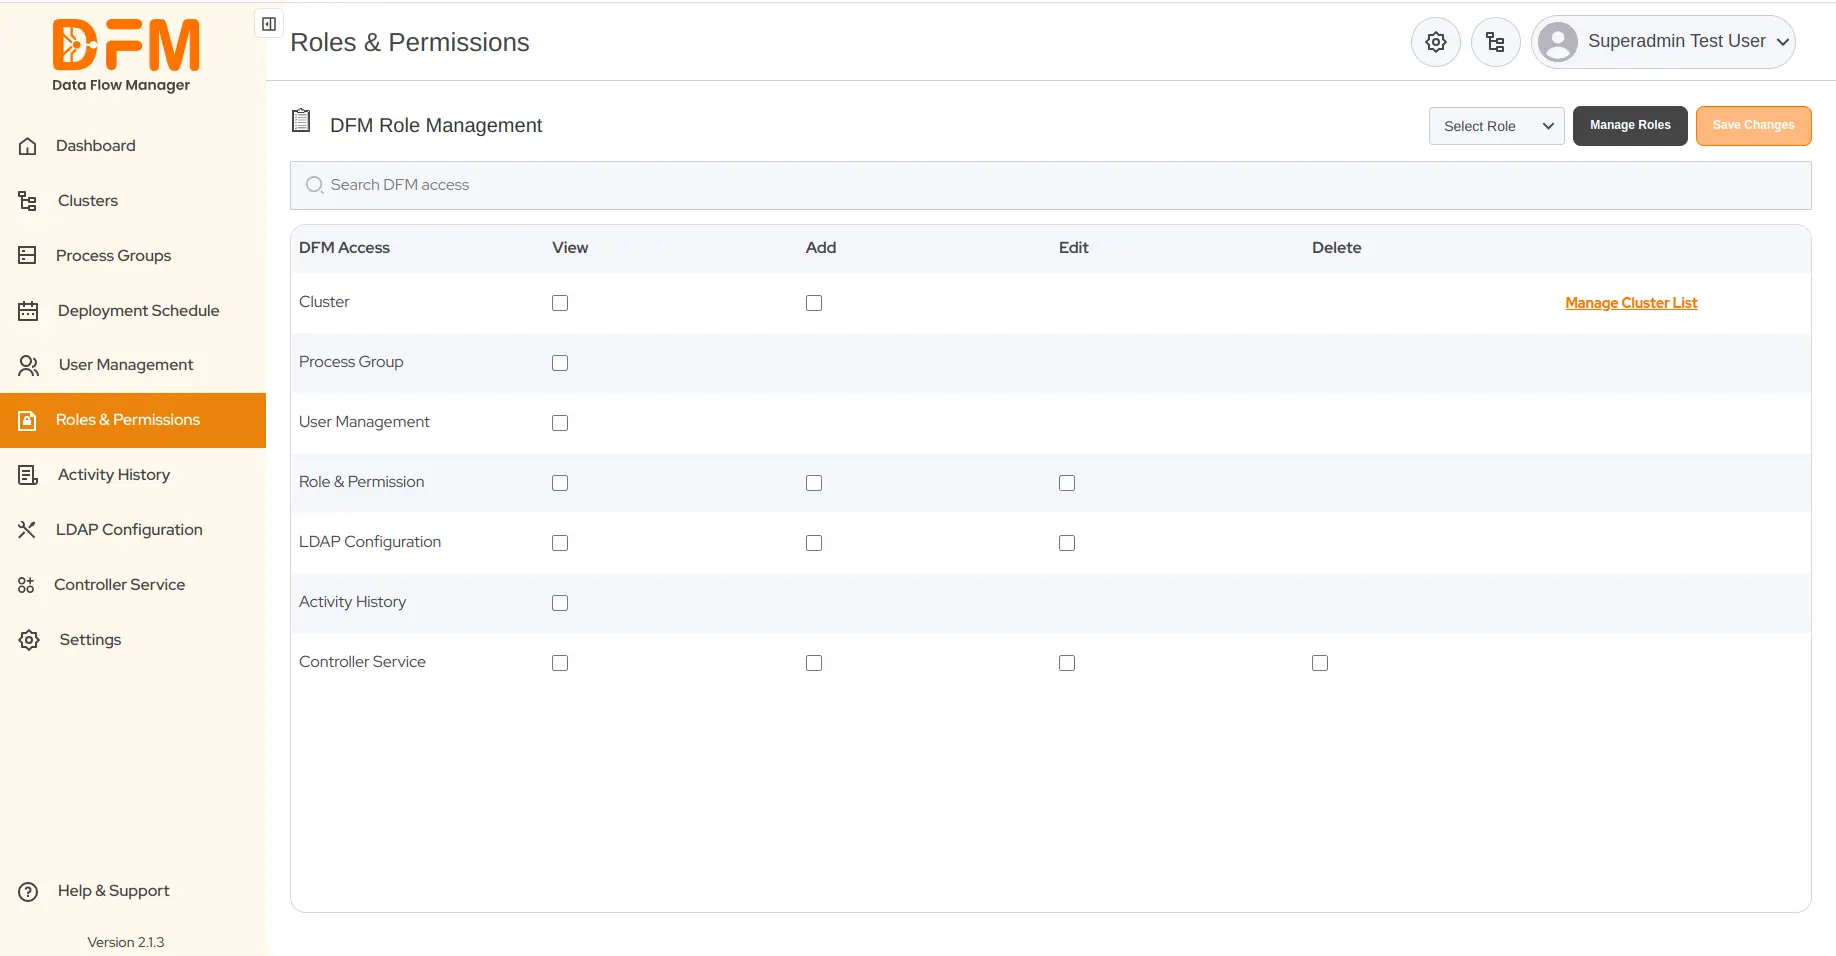
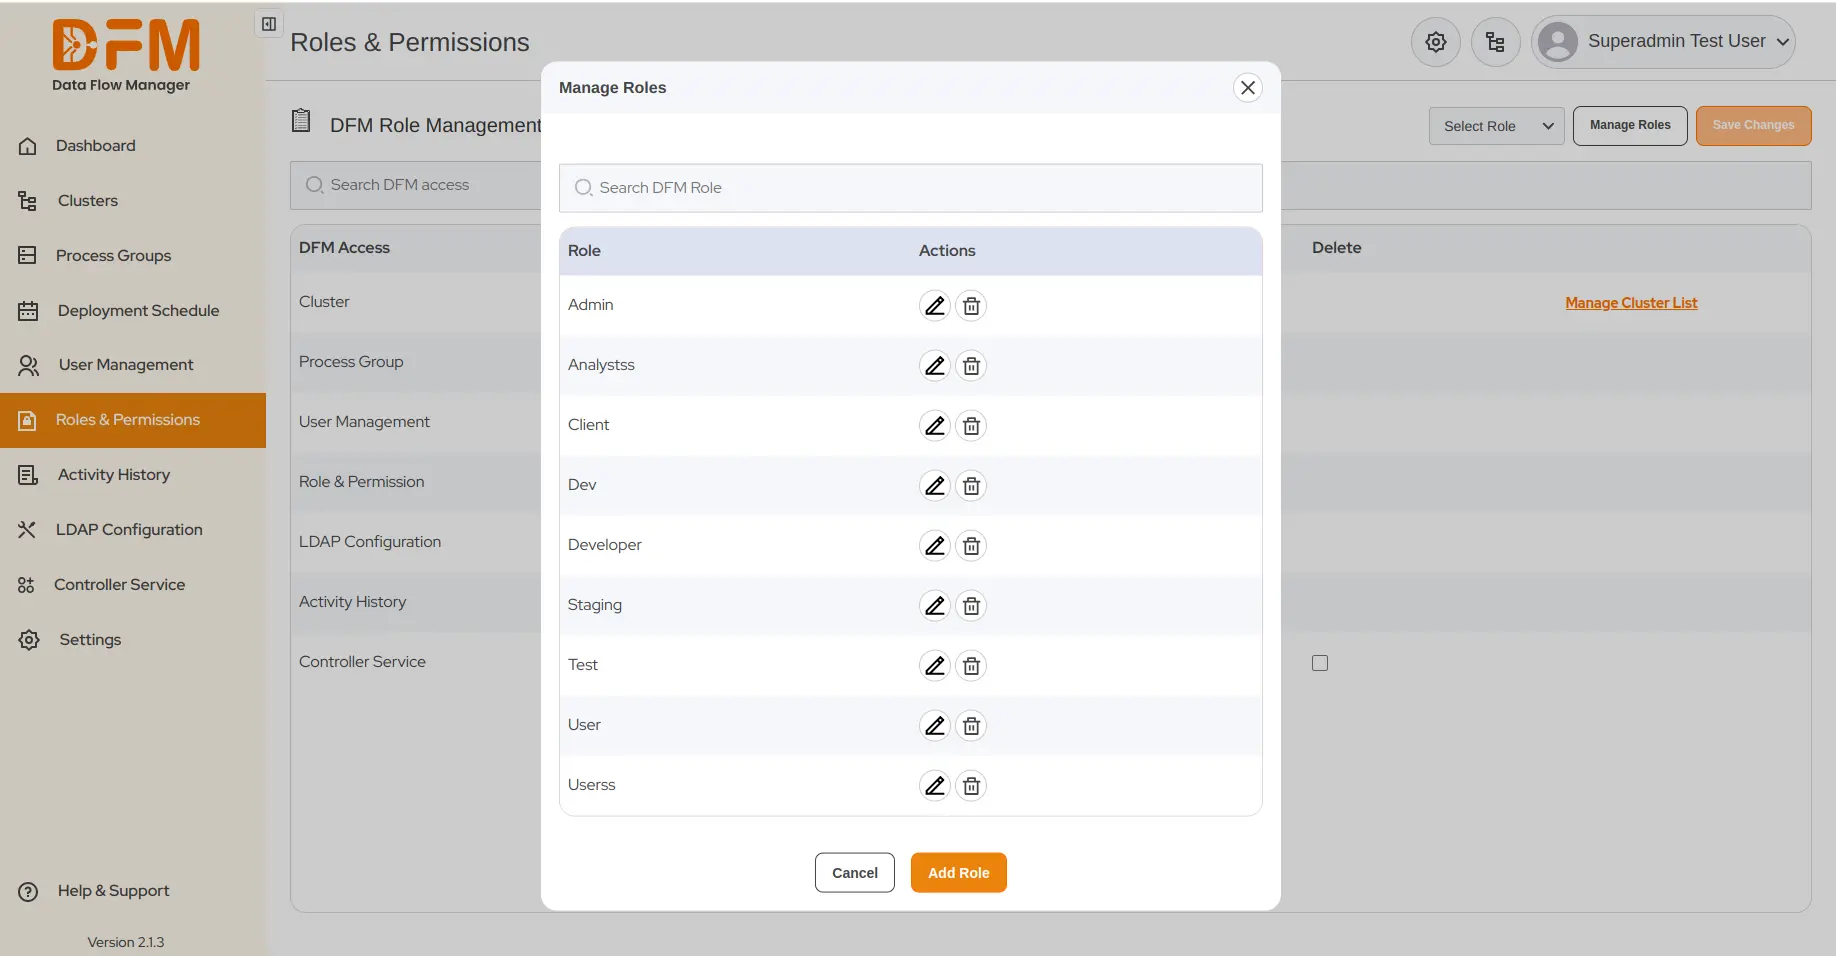
- Go to Manage Roles present in the top right corner of the Roles & Permissions tab.
- Click the Add Role button.
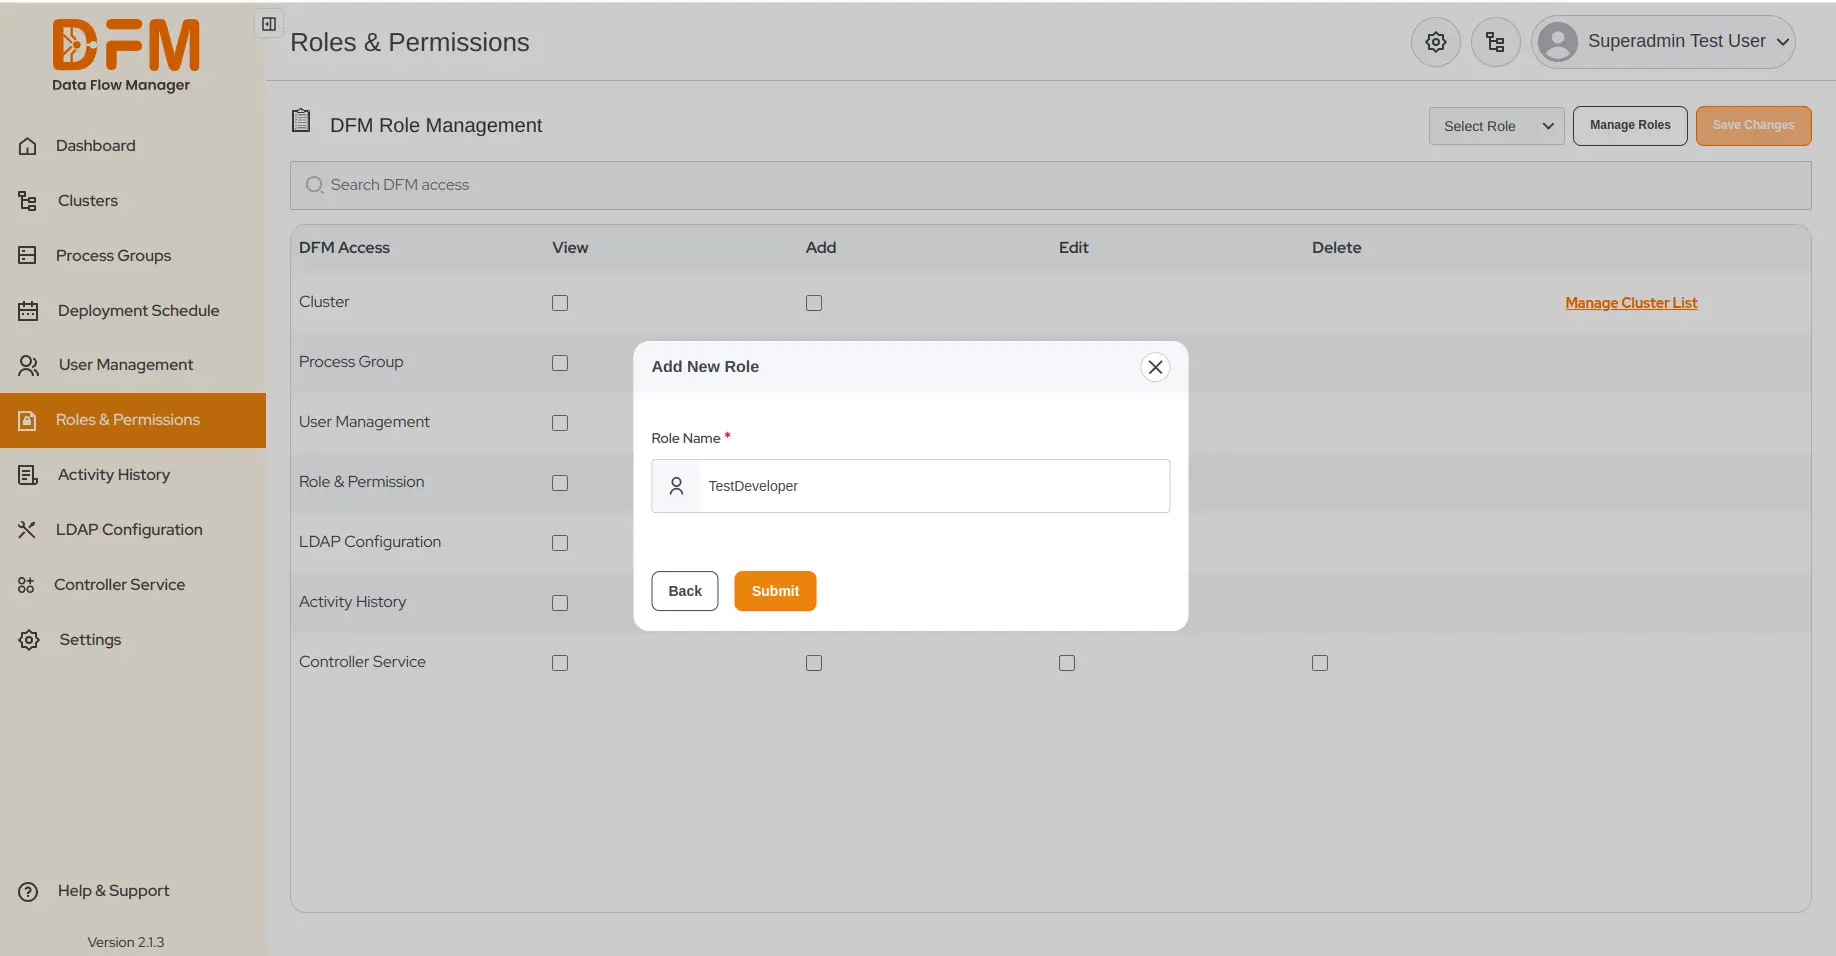
- Enter the role name and click Submit.
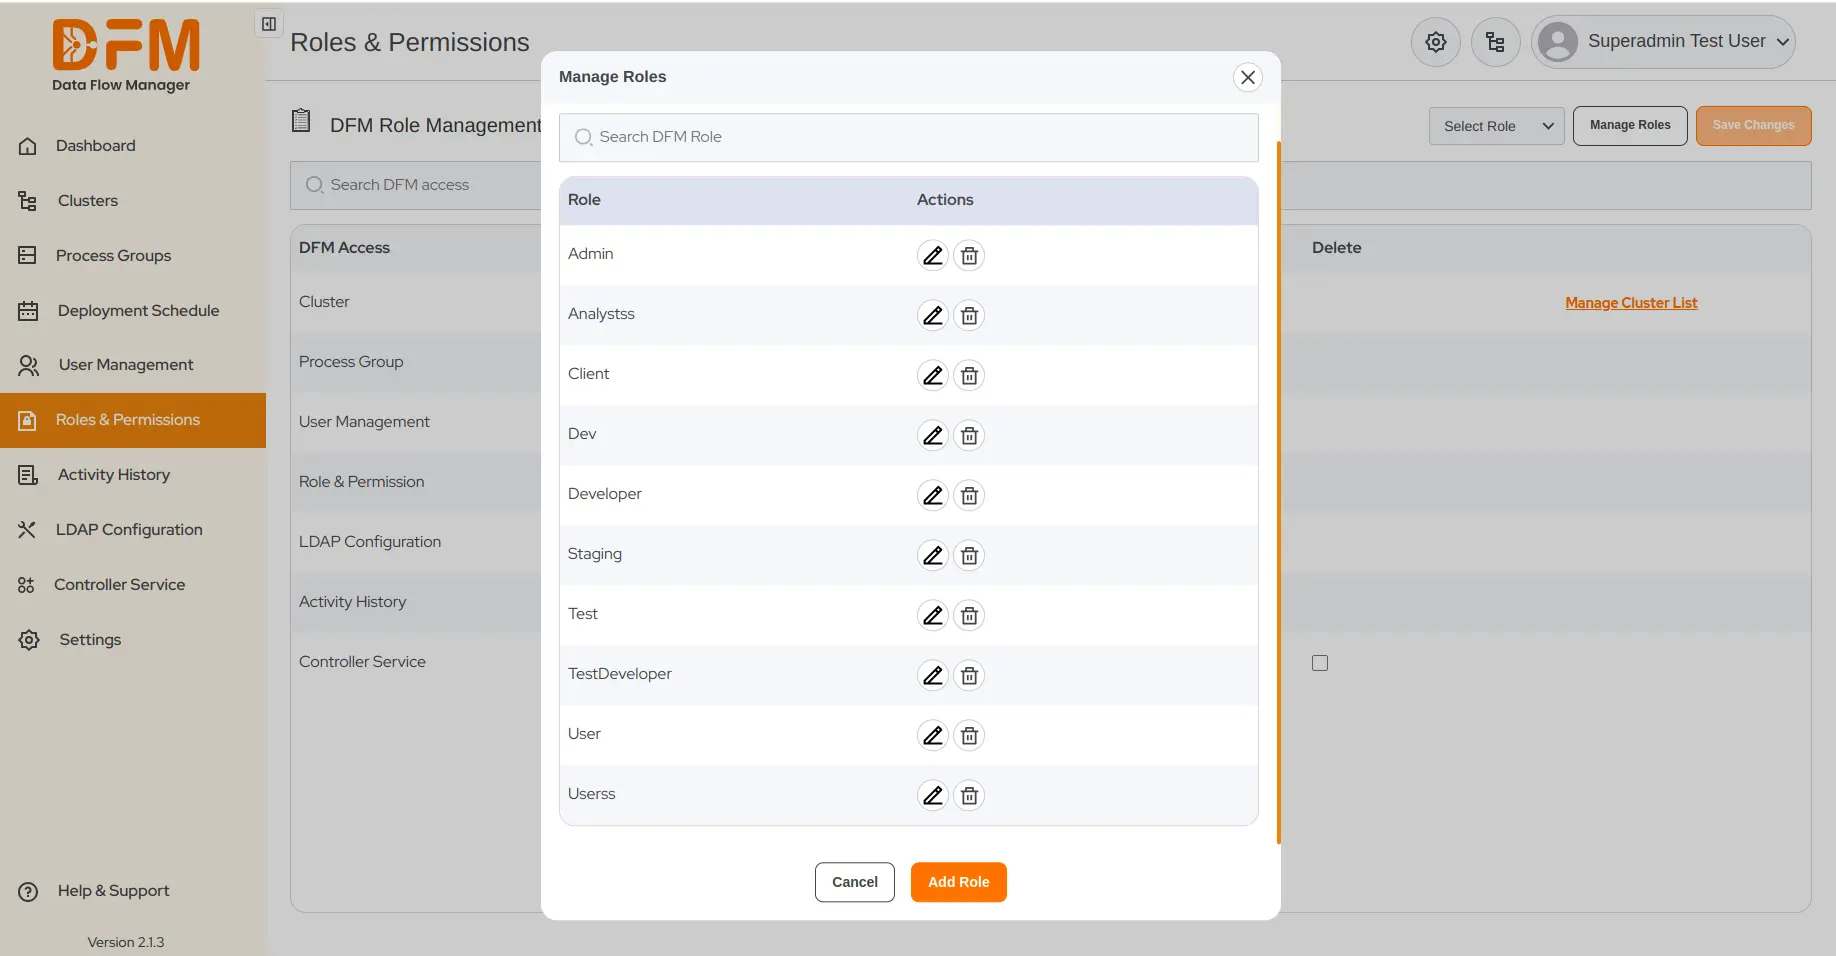
- The new role will be added to the list.
7.2. Edit a user role
You can edit the name of the user role. To do this:
- Go to Manage Role under the Roles & Permissions tab.
- Click on the edit icon for the role you want to edit.
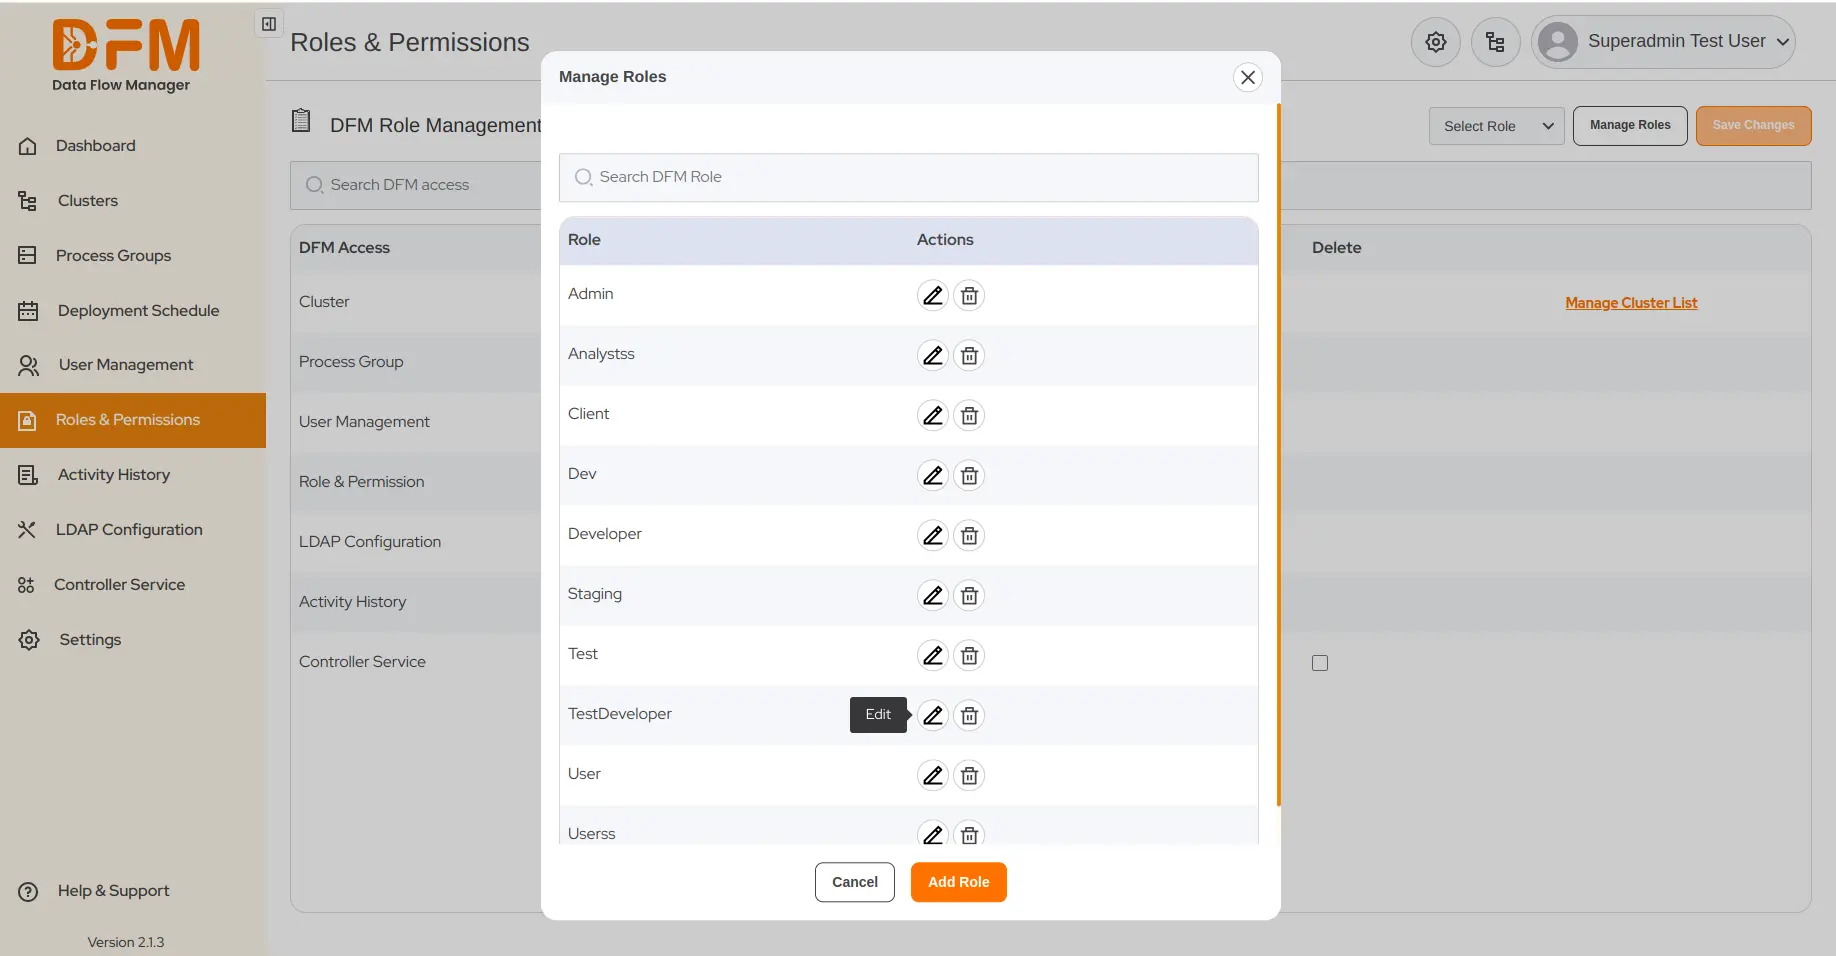
- Change the role name and Submit. You will receive a message indicating that the role has been edited successfully.
7.3. Delete a user role
To delete a user role:
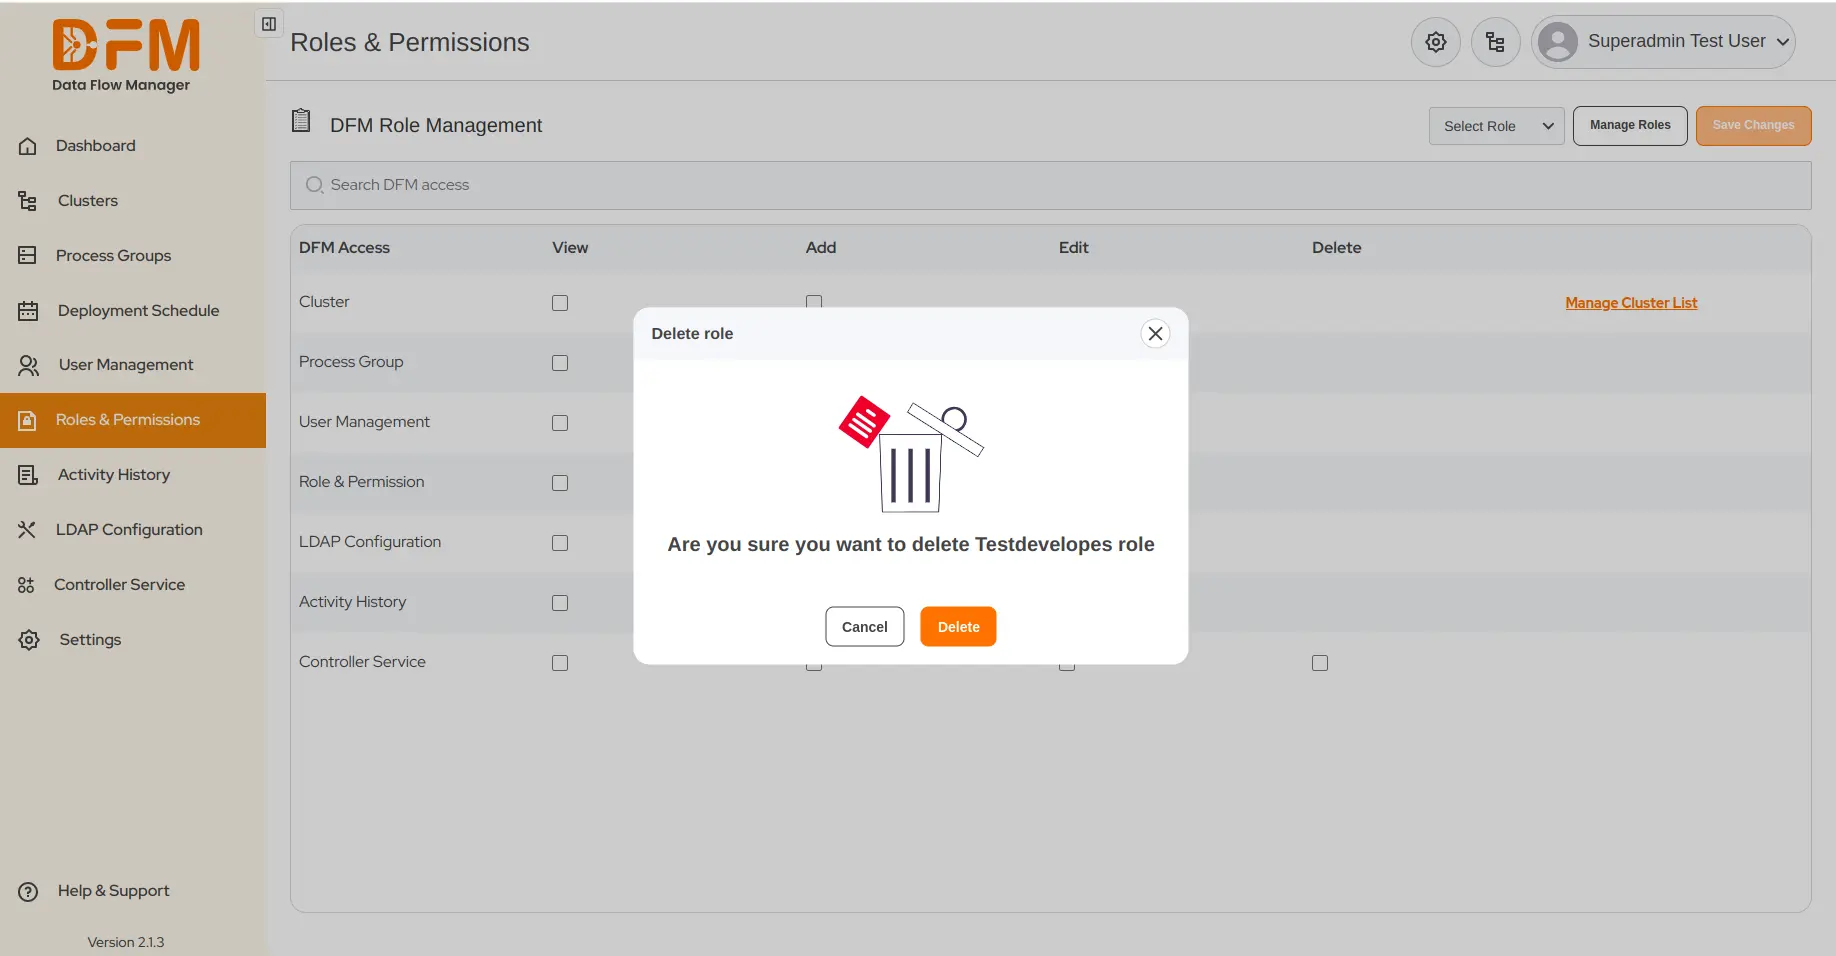
- Navigate to Manage Role under the Roles & Permissions tab.
- Click on the bin icon to delete the desired role.

- A pop appears to confirm whether you want to delete the role or not. Click Delete to delete the user role. A confirmation message appears conveying that the role has been edited successfully.
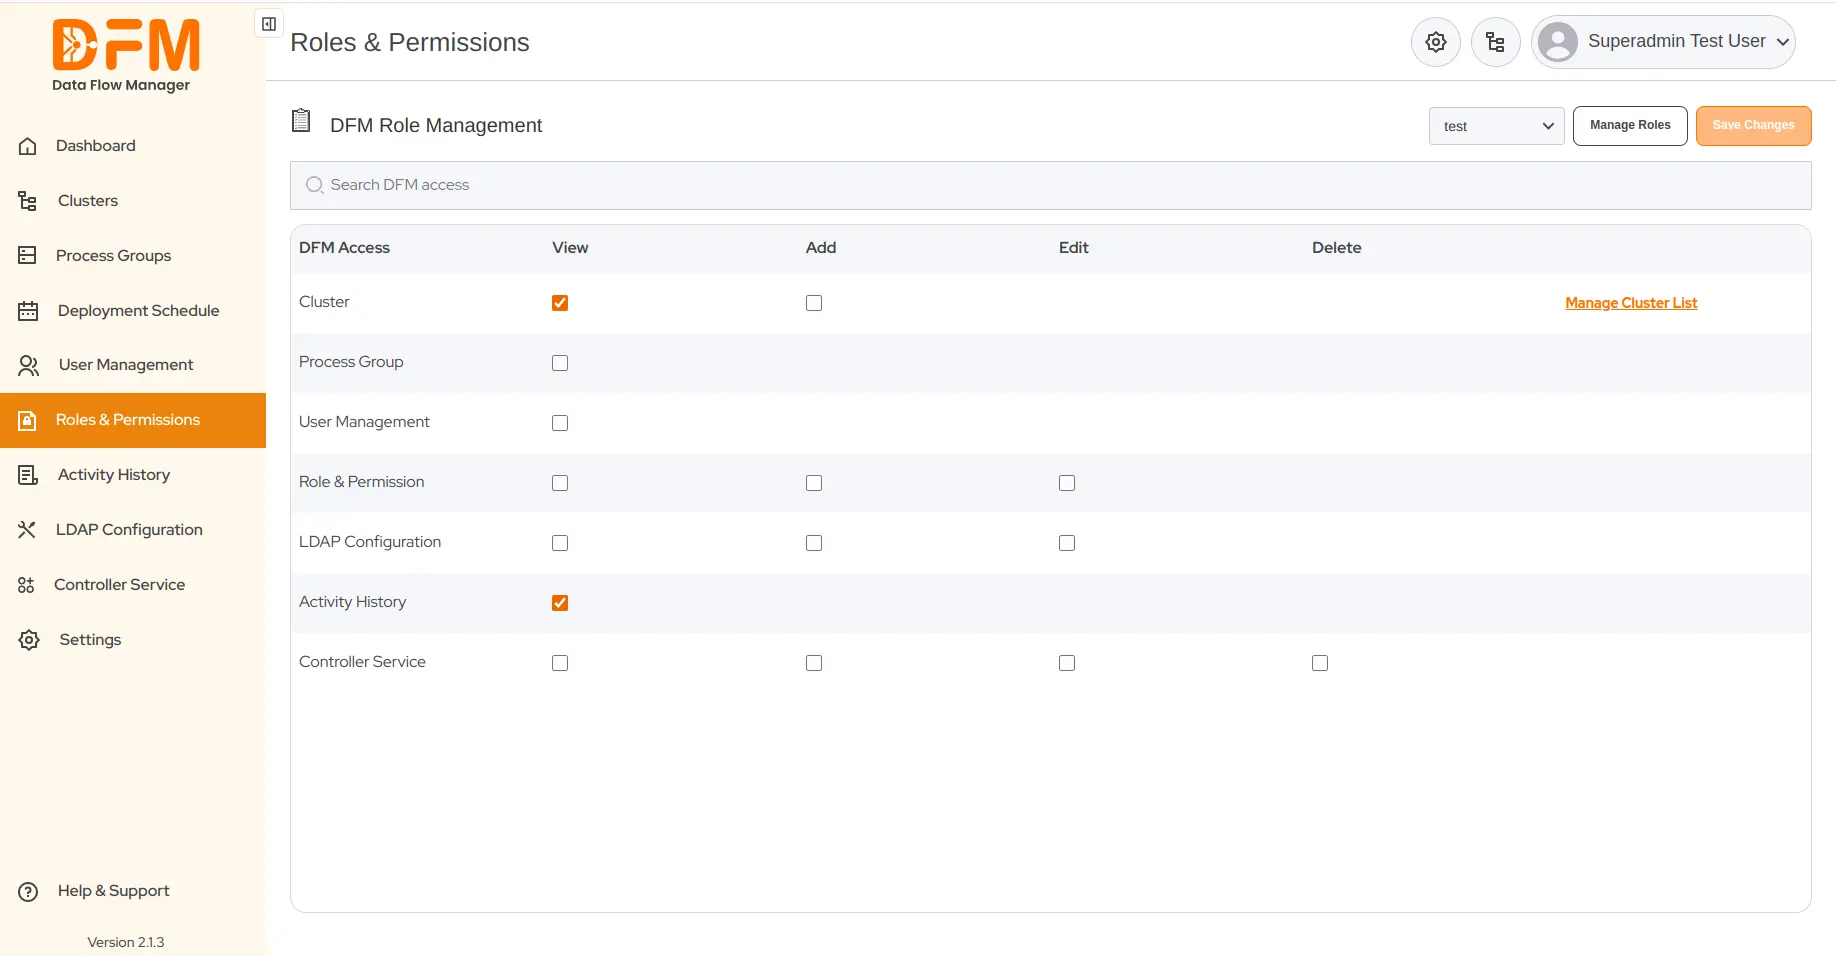
7.4. DFM Role Management
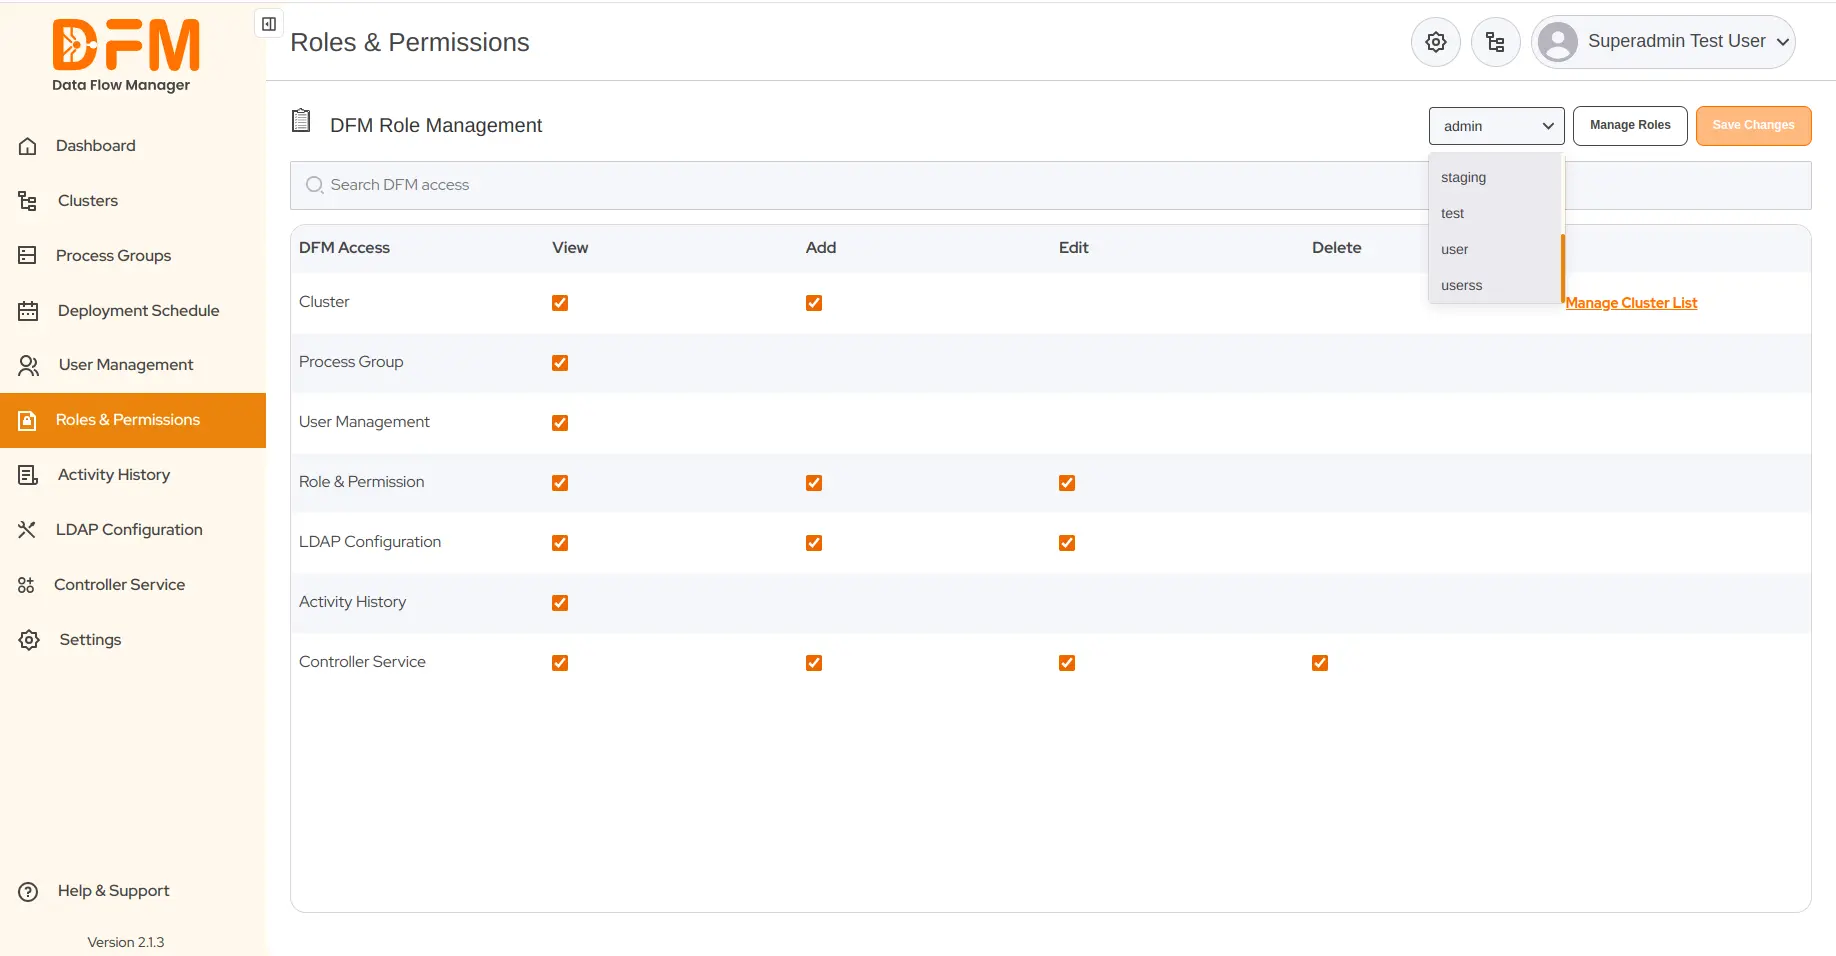
NiFi admins have the right to restrict user access to a few tabs of Data Flow Manager.
- Under the Roles & Permissions tab, select the role from the dropdown.
- Mark the checkbox to grant access rights to users under the selected role based on their responsibilities.
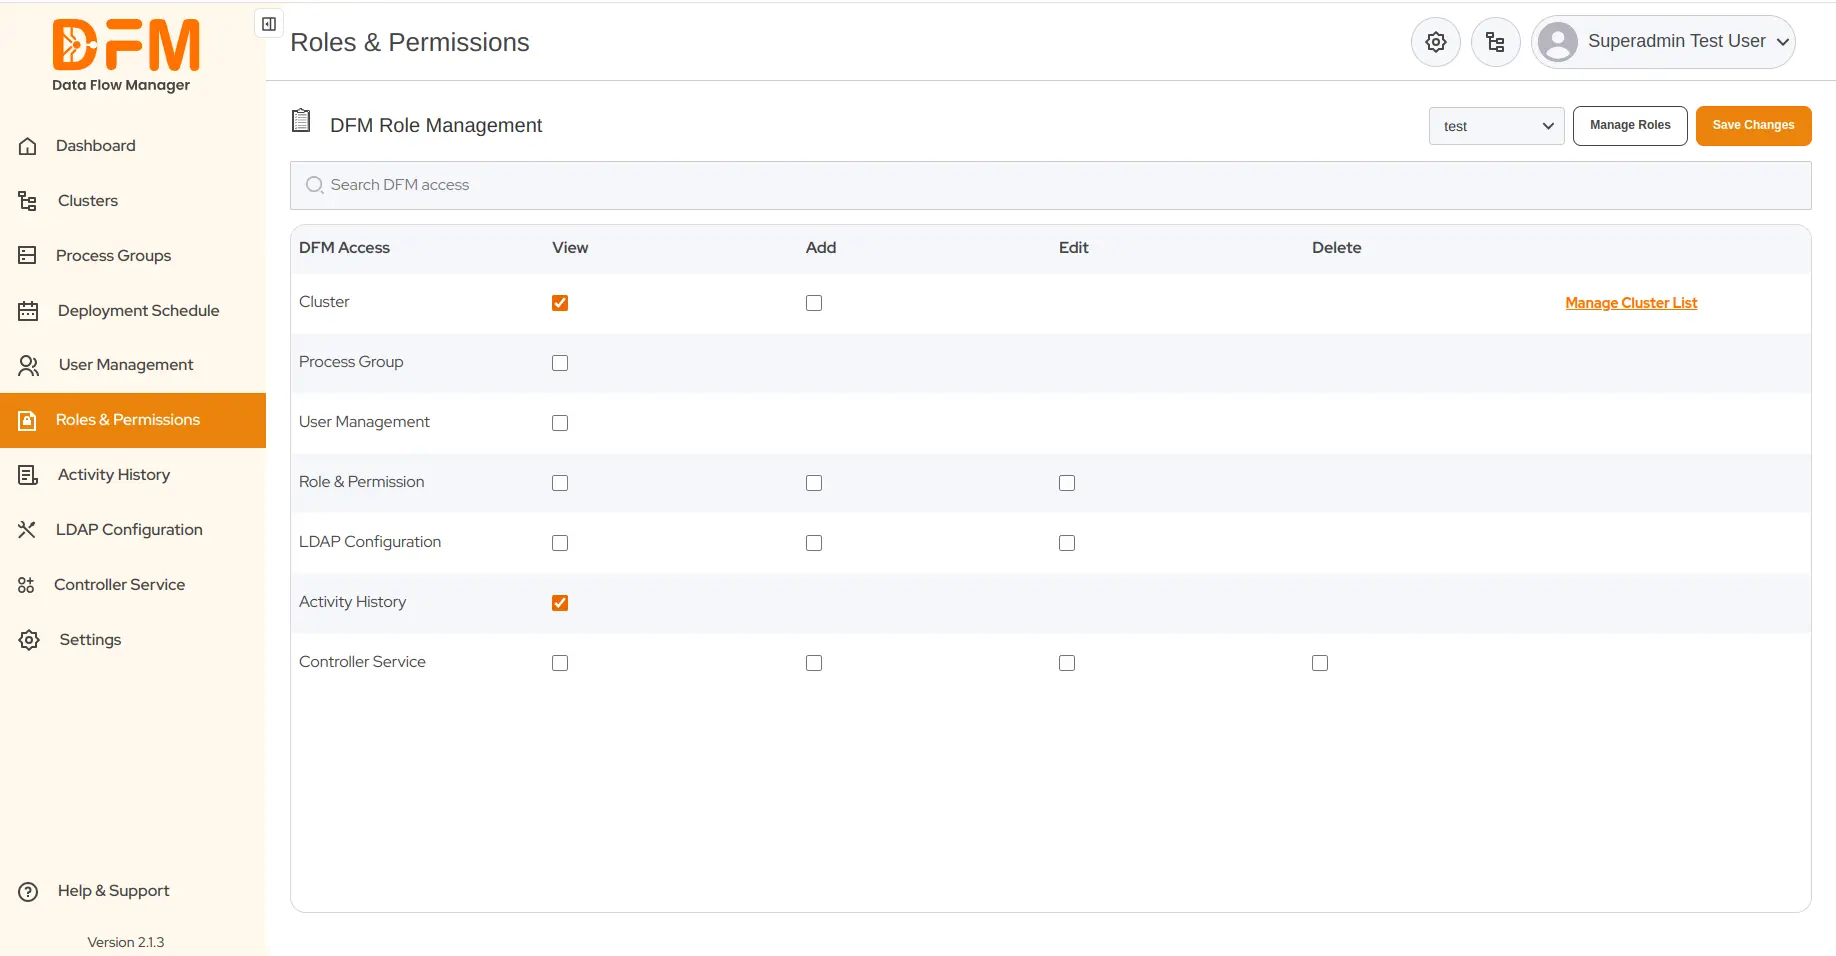
- Once done, click Save Changes. You’ll receive a confirmation message that the role access has been saved successfully.
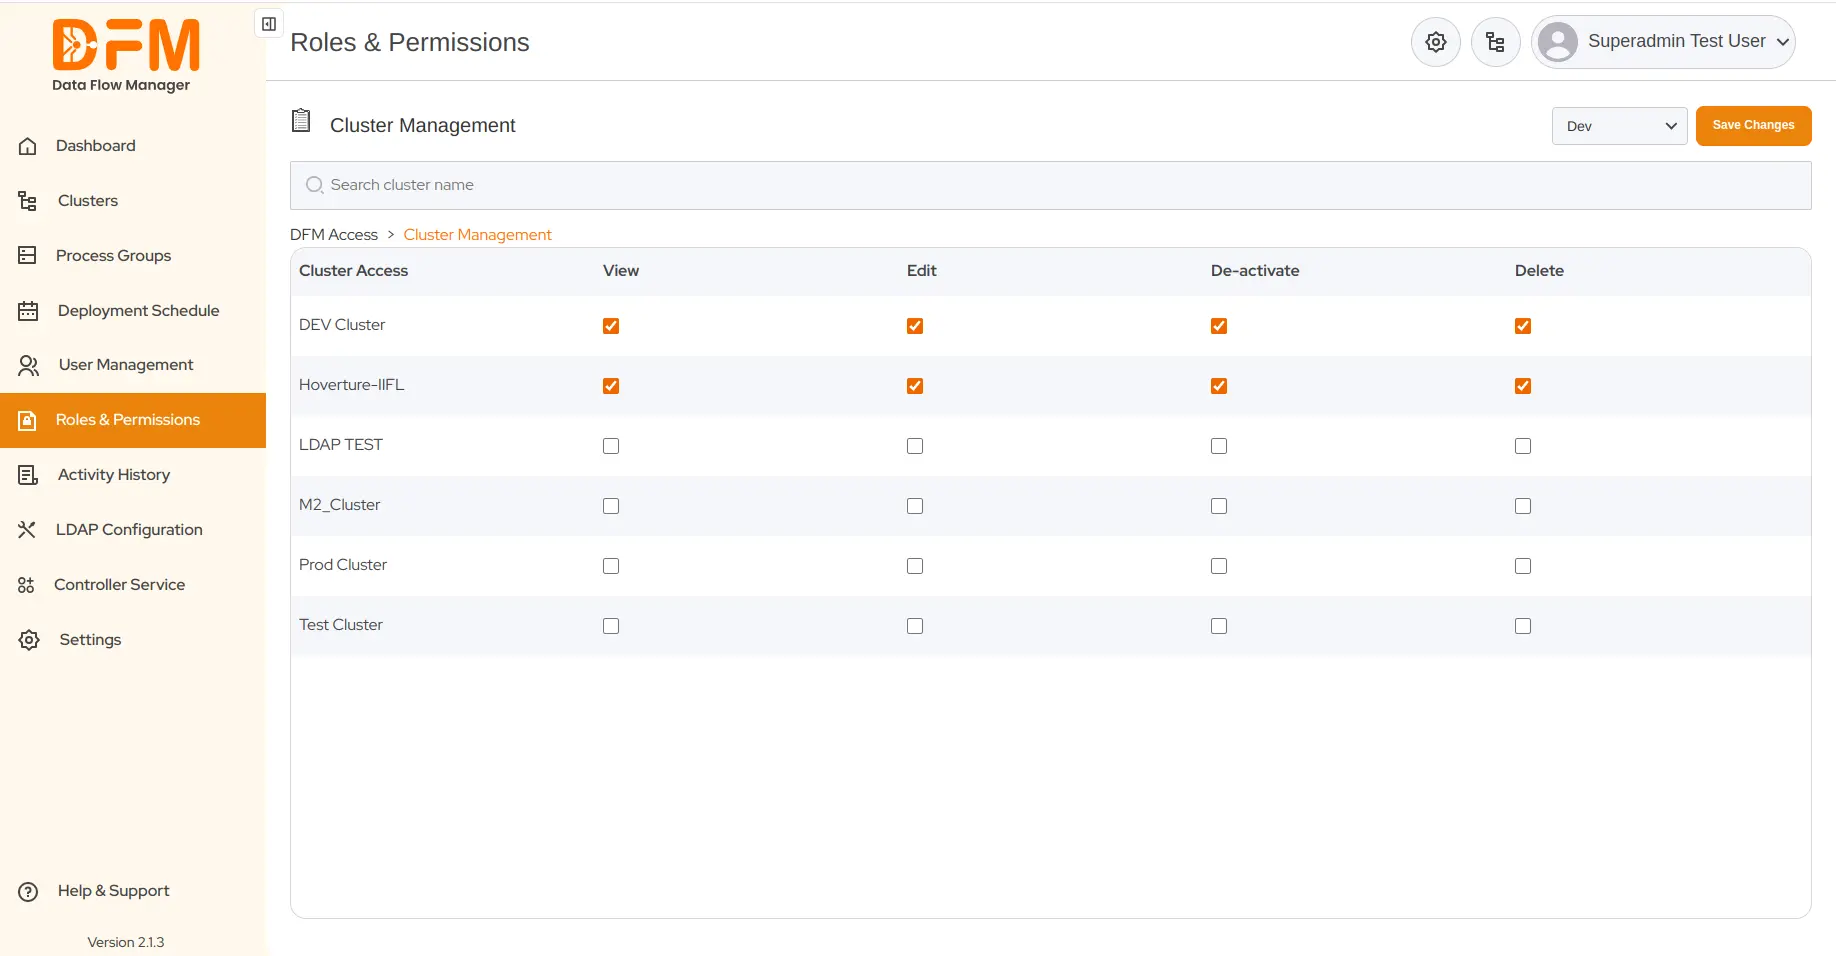
7.5. Cluster Management
To manage access rights to clusters,
- Click Manage Cluster List.
- You’ll be redirected to the cluster list. Select the user role from the dropdown.
- Mark the checkbox for permissions you want to grant to the selected role – view, edit, delete, & deactivate for the clusters mentioned.
- Finally, click Save Changes.
8. Activity History
The Activity History tab provides a detailed history of user actions on various entities, including the cluster, process group, registry, and controller service. It includes details such as the action performed on the entity, associated messages, timestamps, status, and the name of the user who performed it.
Data Flow Manager lets you filter the activity history based on 3 parameters – Entity, Event, & Status.
8.1. Filter the activity history based on the entity
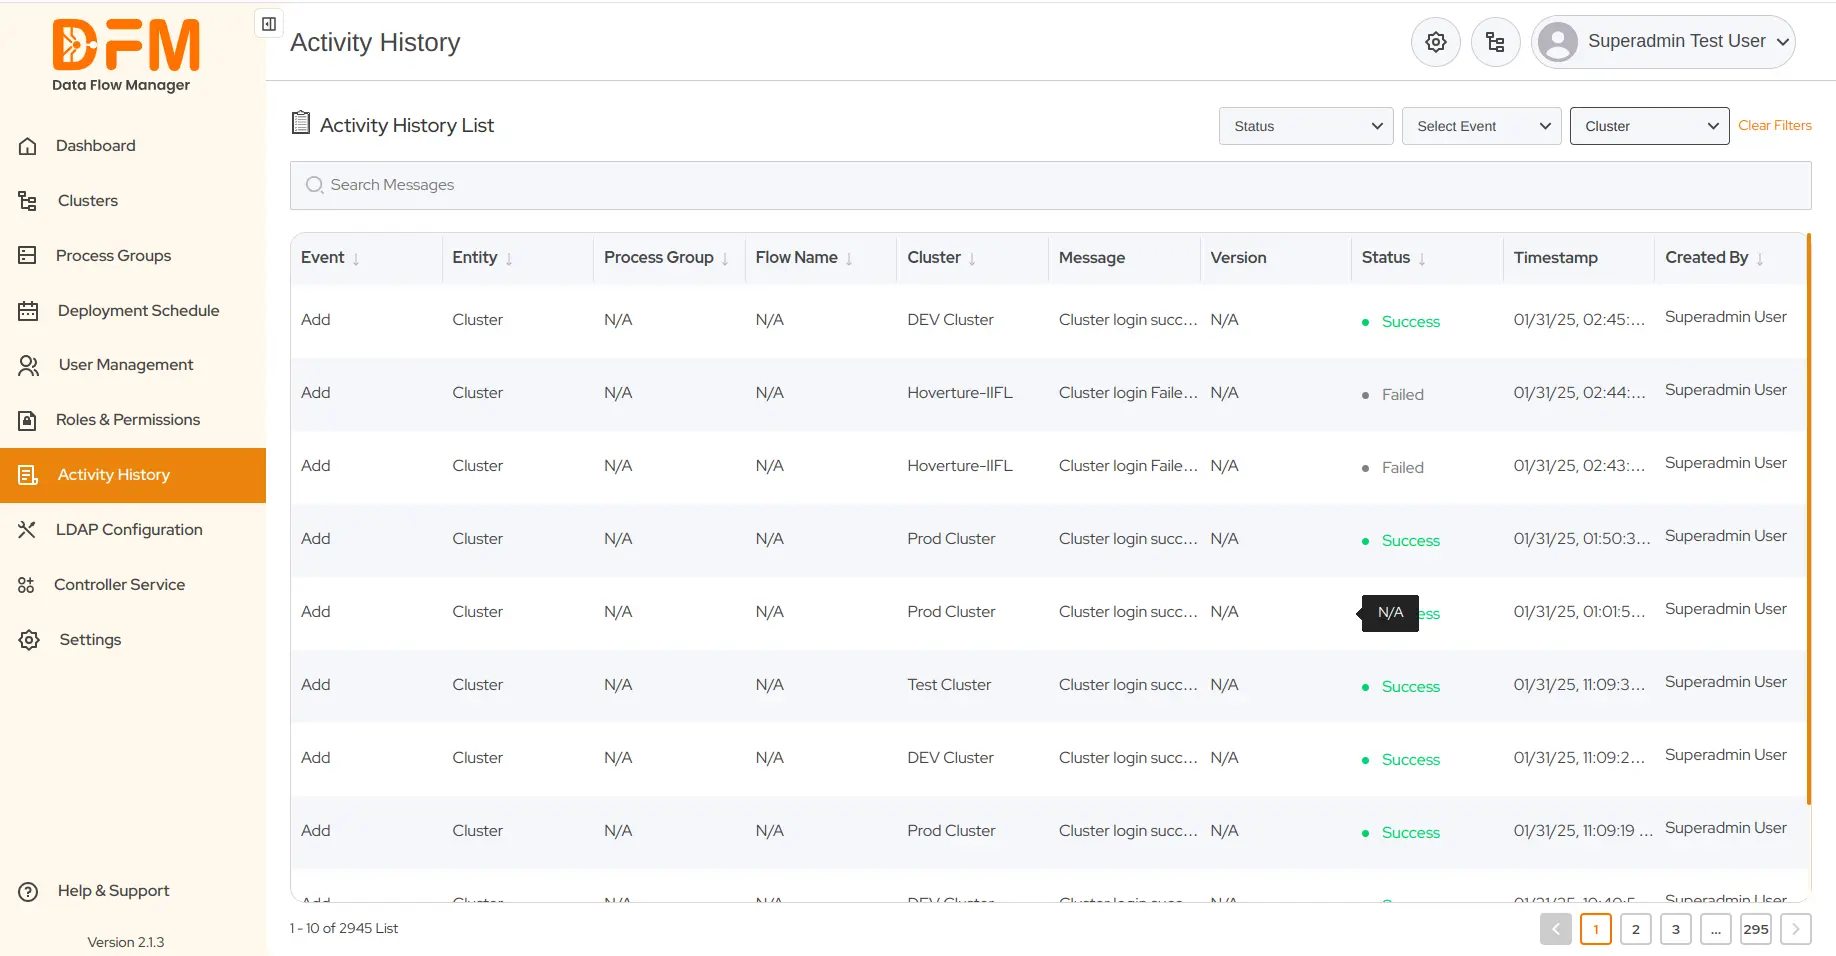
Here, the entities are clusters, process groups, registries, controller services, and users. To filter the activity history based on these entities:
- Go to the Select Entity dropdown present in the top-right corner.
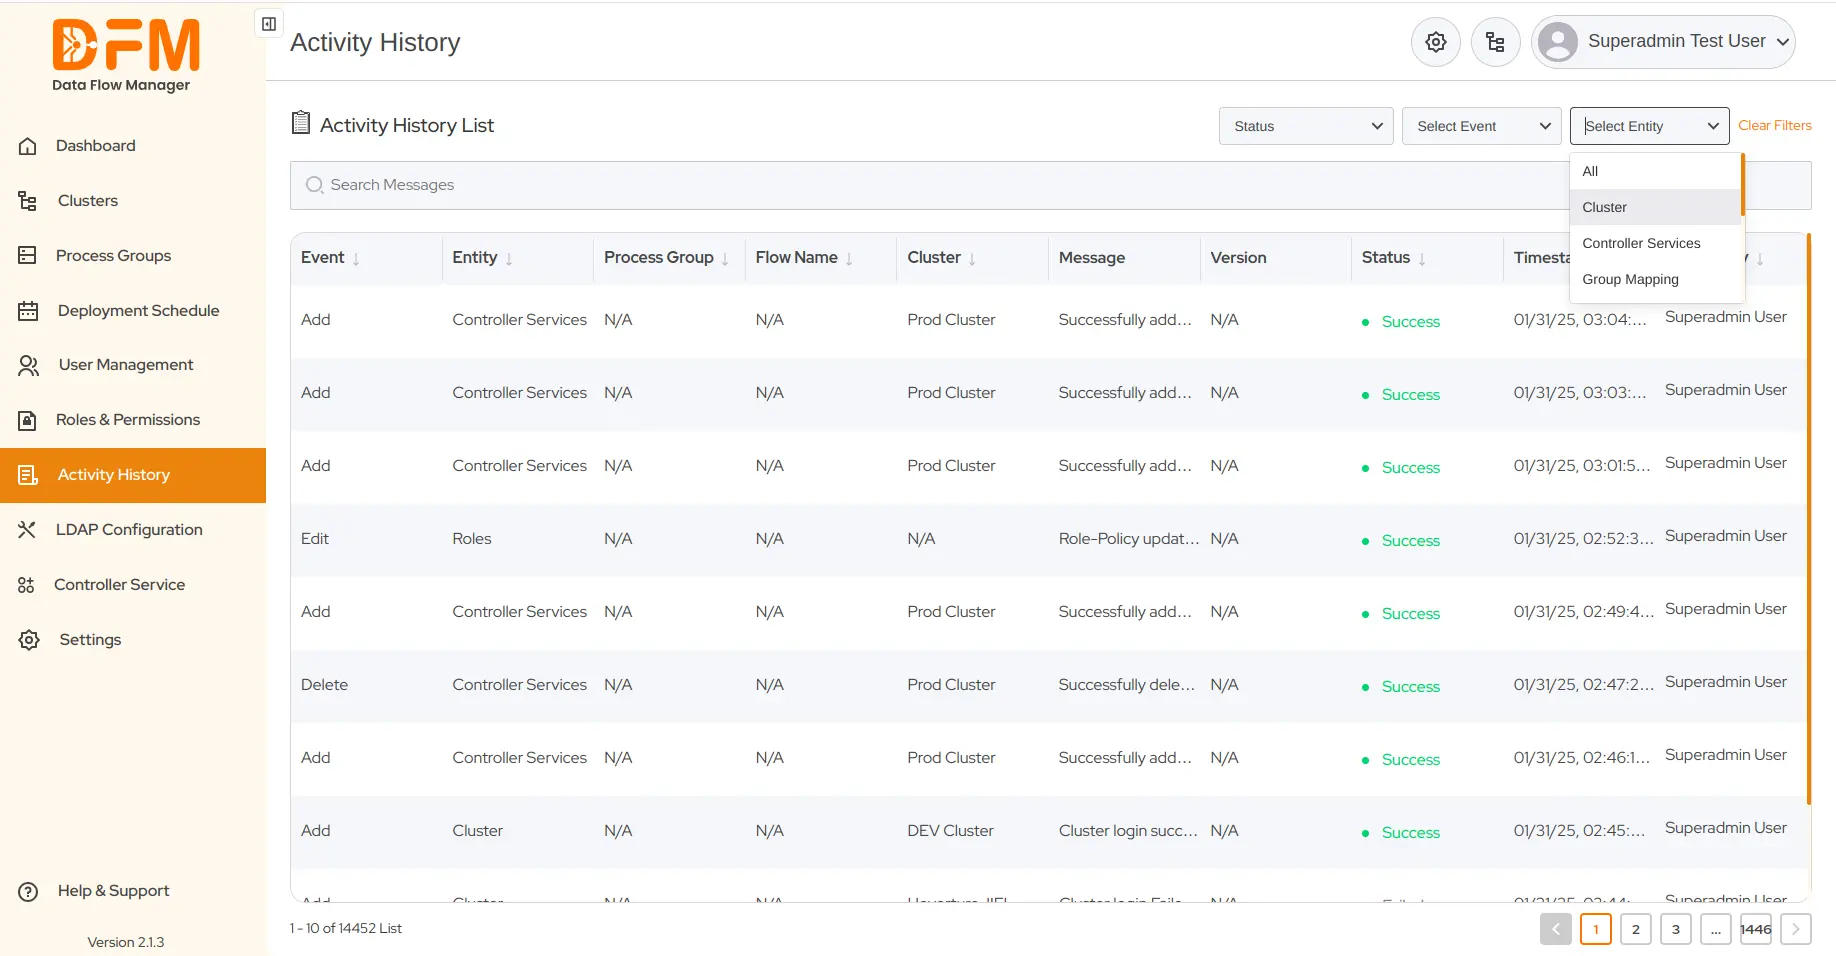
- Choose the required entity to get the activity history accordingly.
8.2. Filter the activity history based on the event
Filter the activity history by actions, like add, delete, deploy, upgrade, etc.
- Go to the Select Event dropdown.
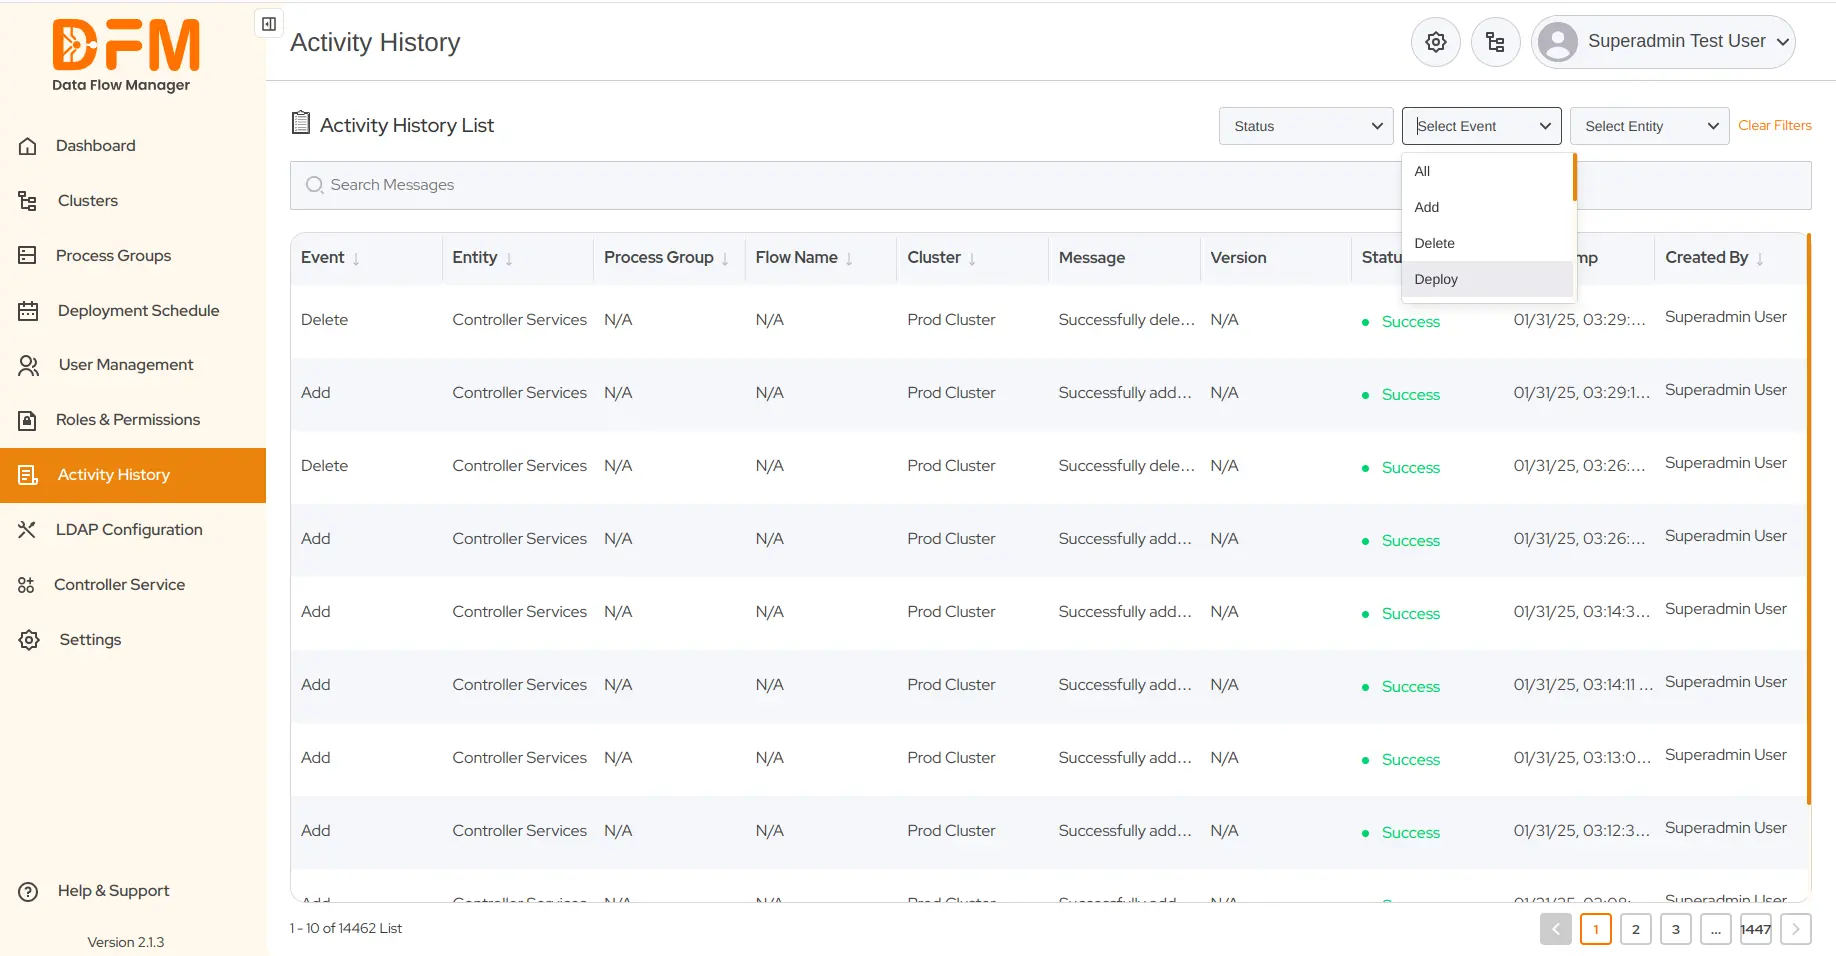
- Click the desired event to get the filtered activity history.

8.3. Filter the activity history based on the status
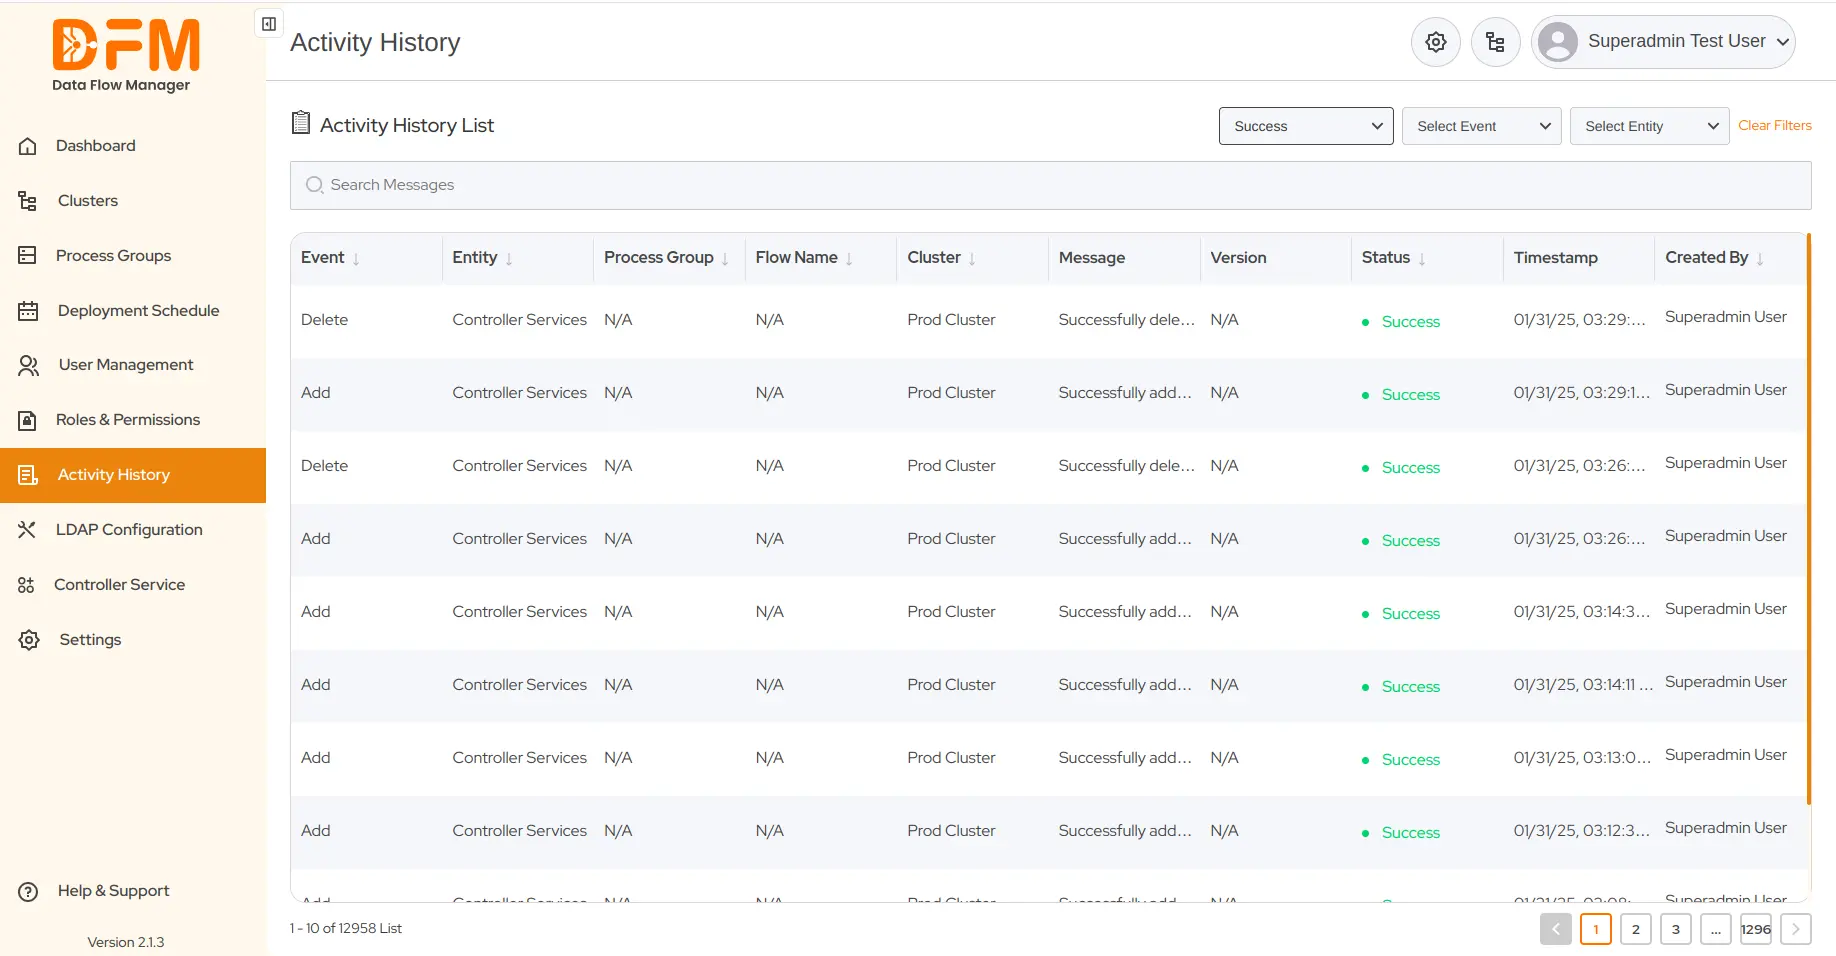
Filter activities based on the event’s status - Success, Failed, or All.
- Go to the Status dropdown.
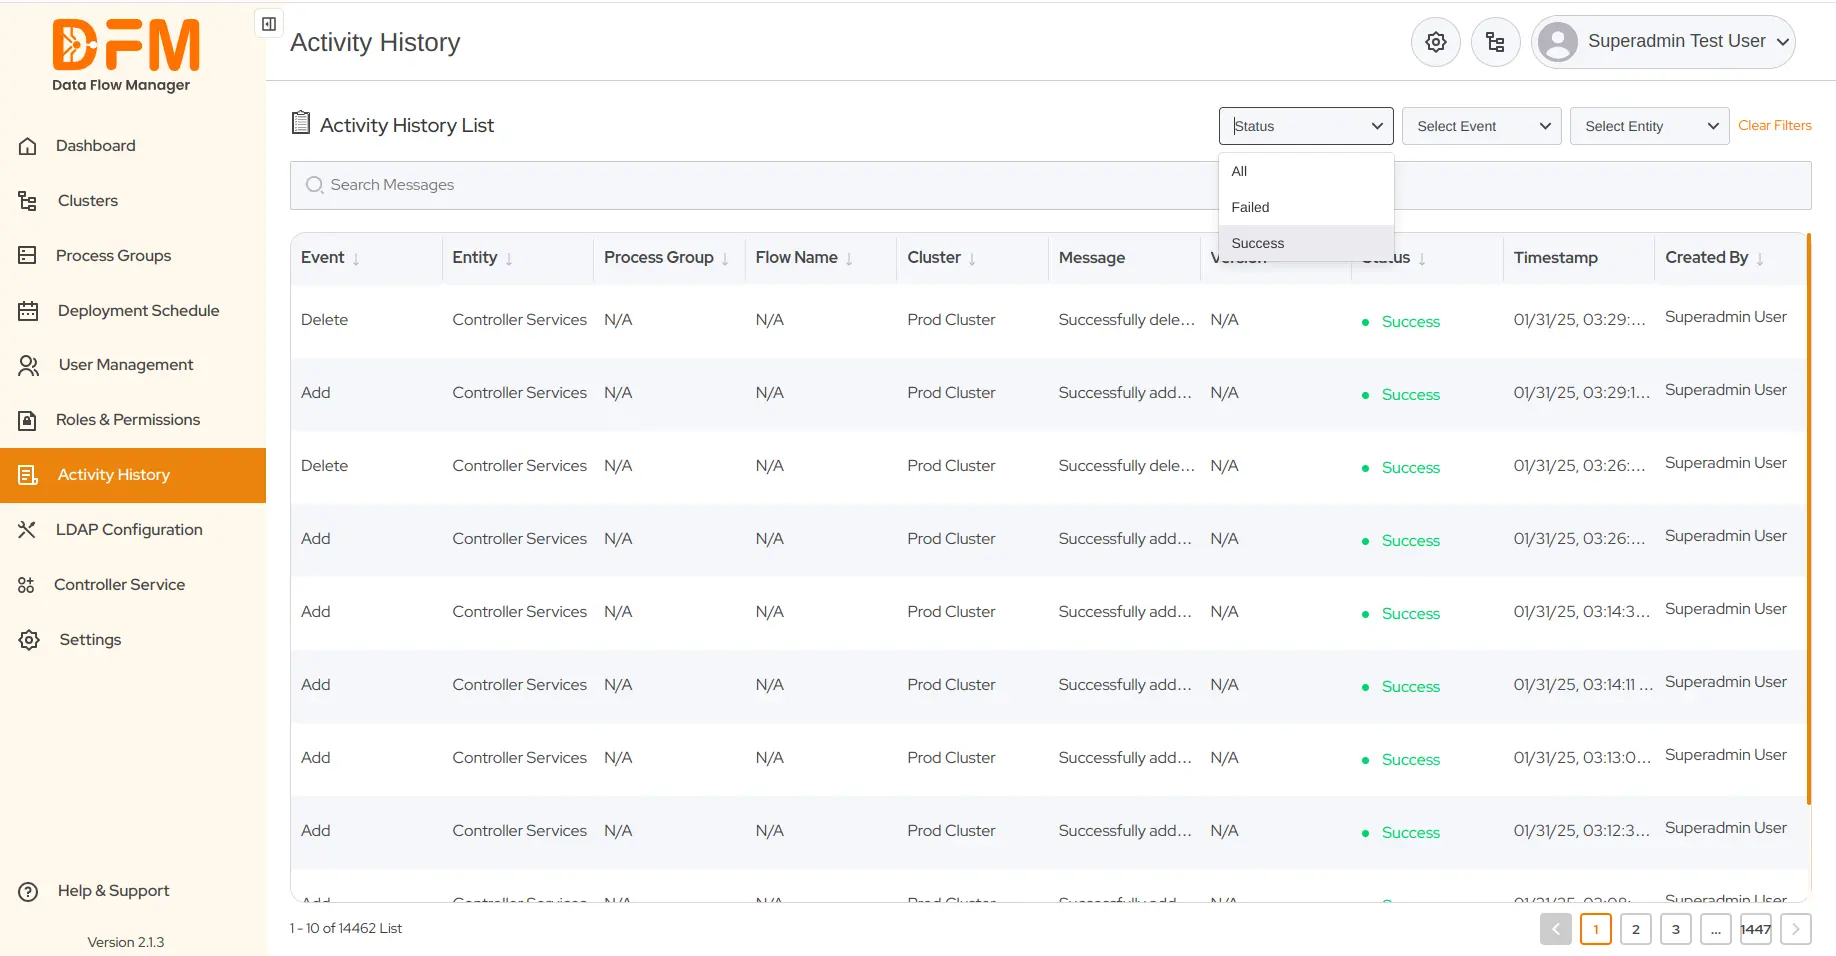
- Choose whether you want to track activities based on the Failed or Success status.
9. LDAP Configuration
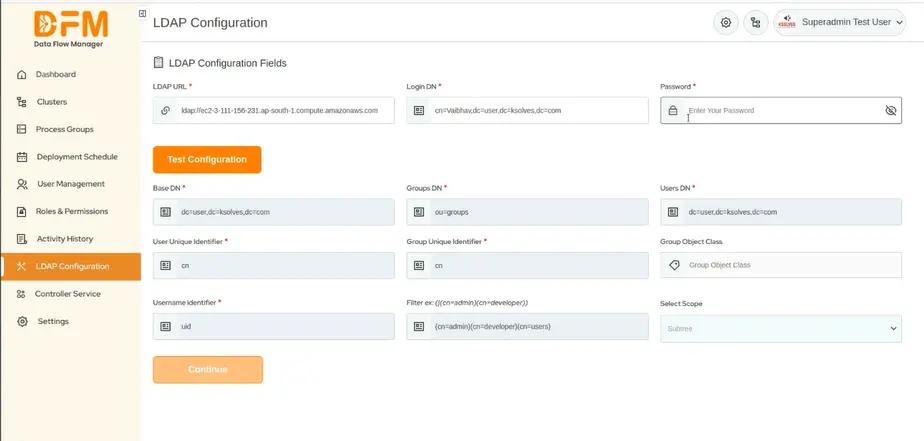
Go to the LDAP Configuration tab and perform the following steps:
- Add the LDAP URL and enter the Login DN along with the password to establish the LDAP connection.
- Once you’ve entered the details, test the configuration. If successful, you will see a success dialog box.
- After the successful test, add any required configurations and click Continue.
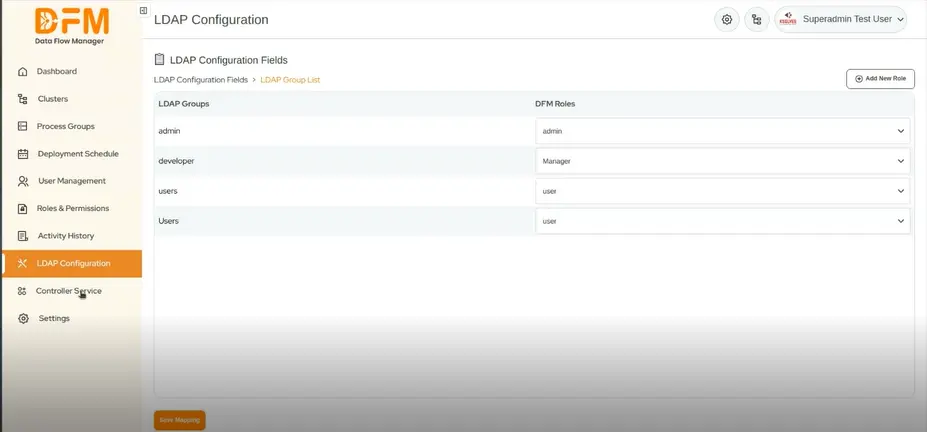
- You can now assign DFM roles to the respective LDAP roles.
- To create a new role, use the Add New Role button in the top-right corner. This will create a new role in DFM.
10. Controller Service
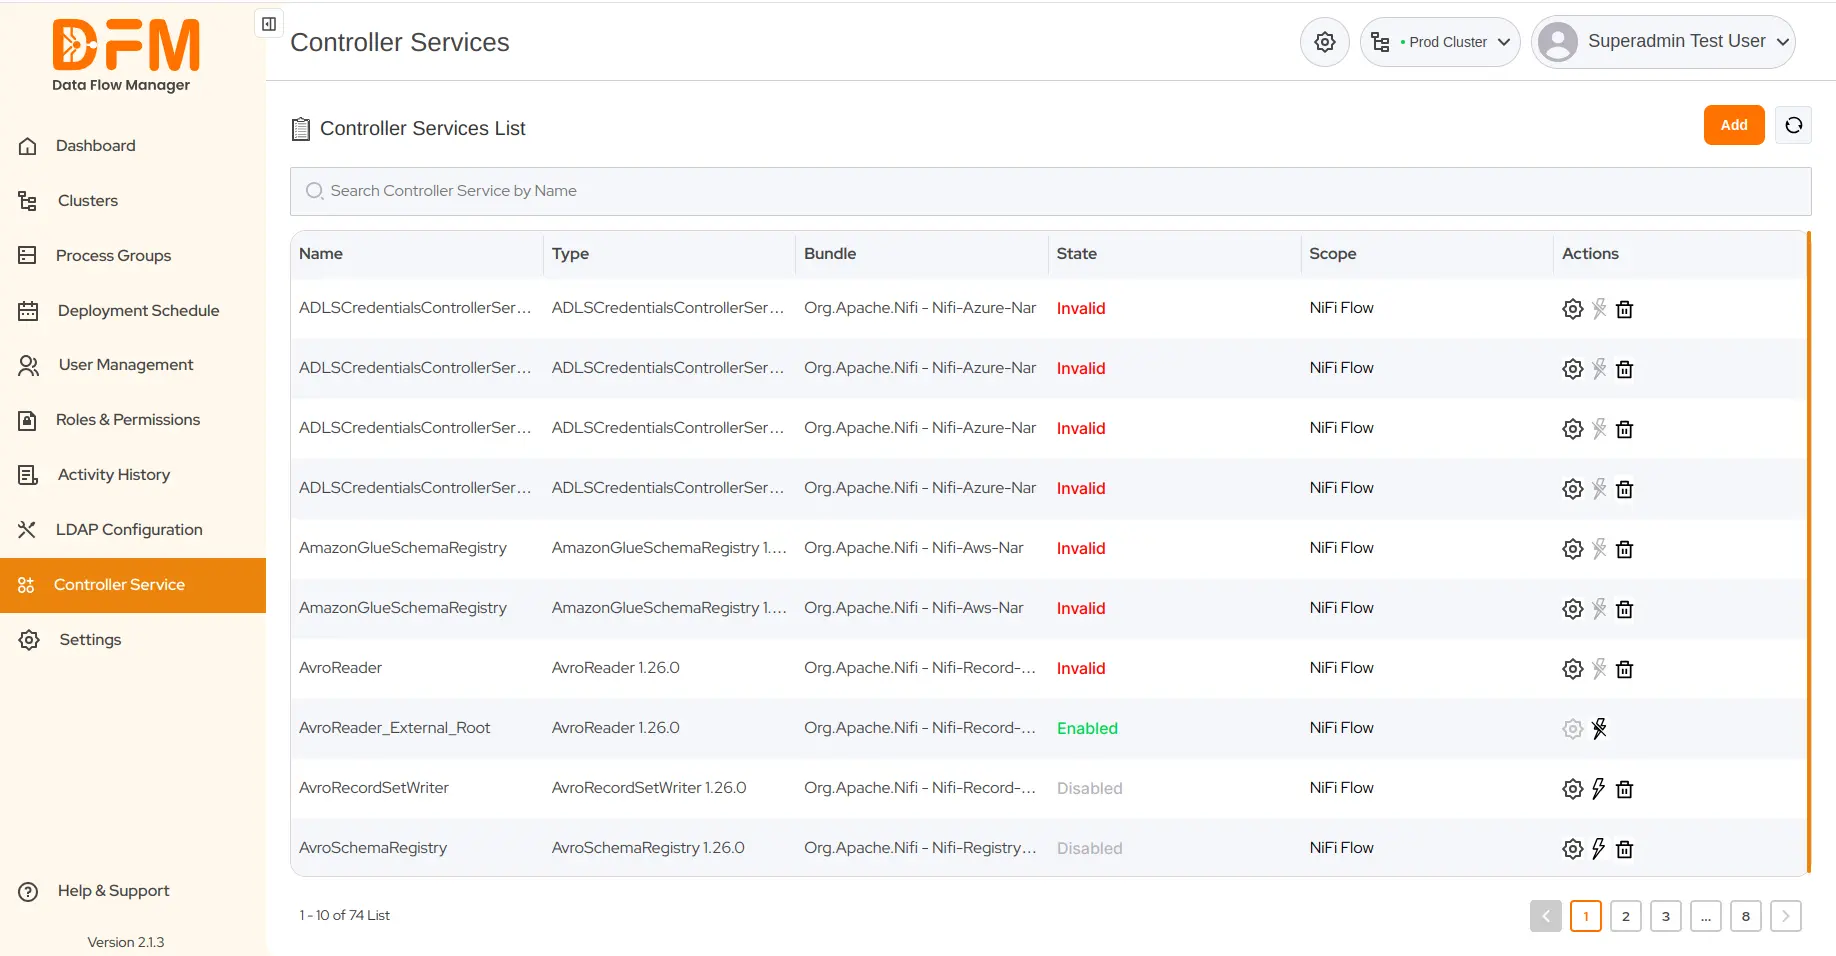
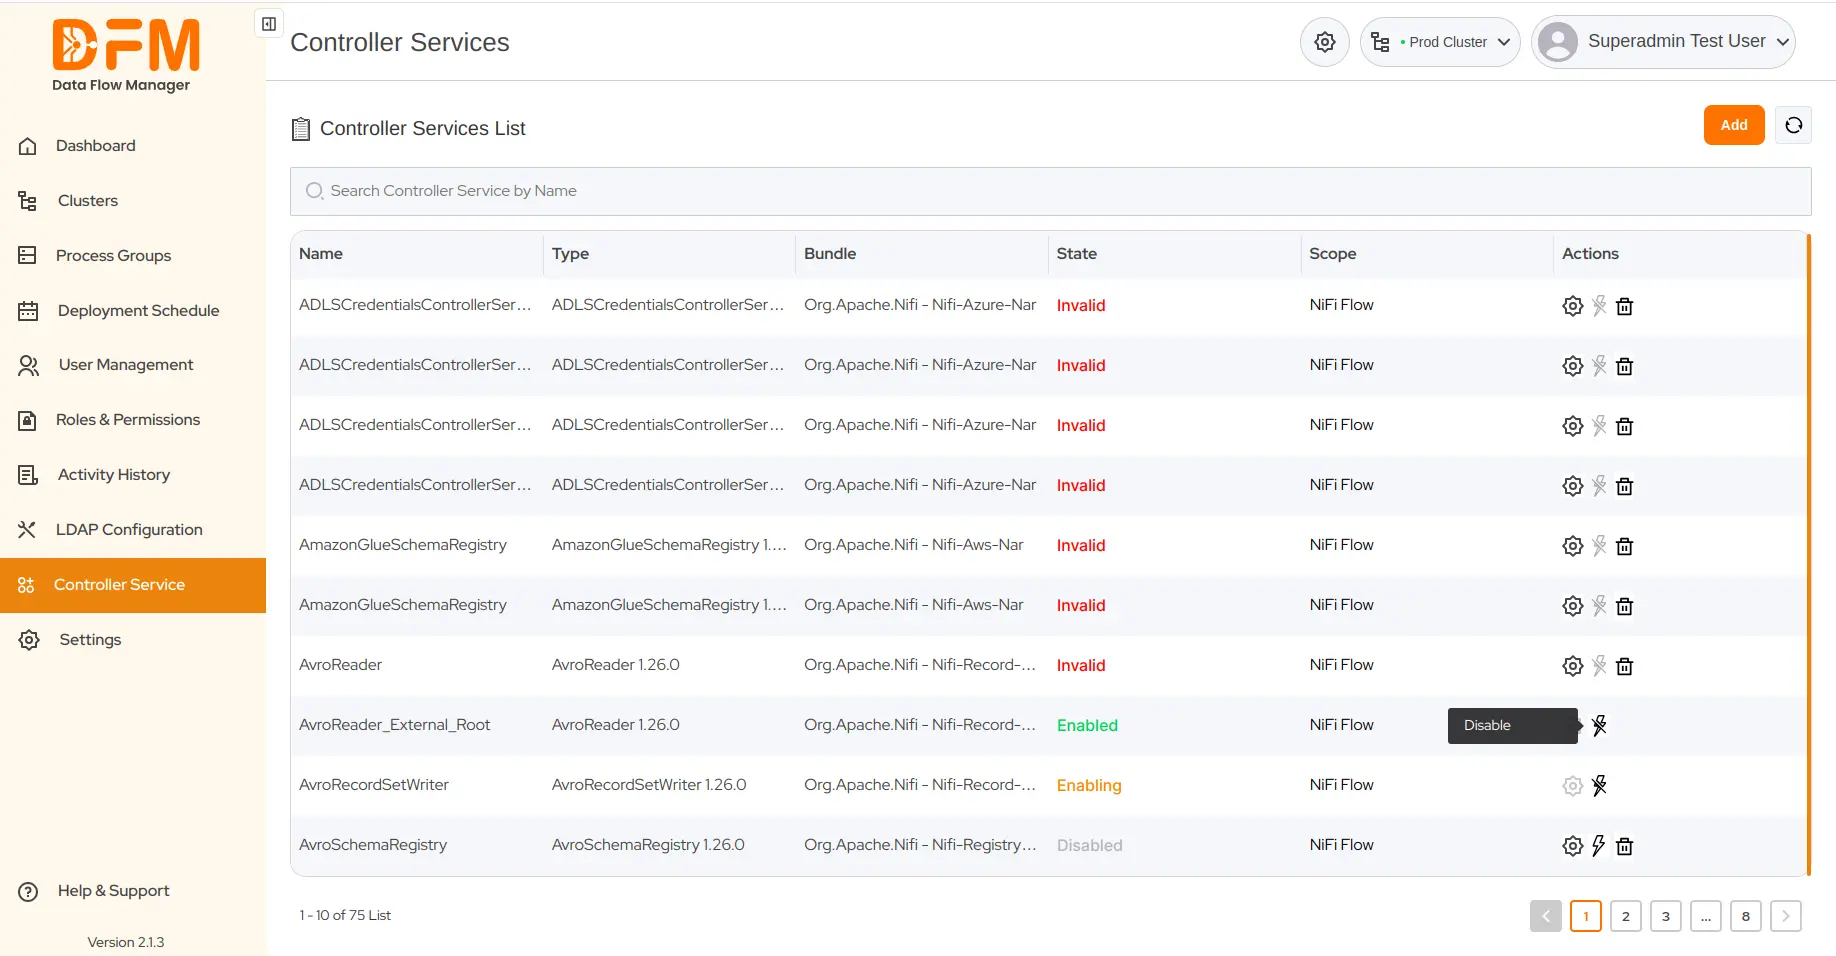
The Controller Service tab lists all controller services with their name, type, bundle, state, scope, and actions.
10.1. Add a new controller service
Under the Controller Service tab,
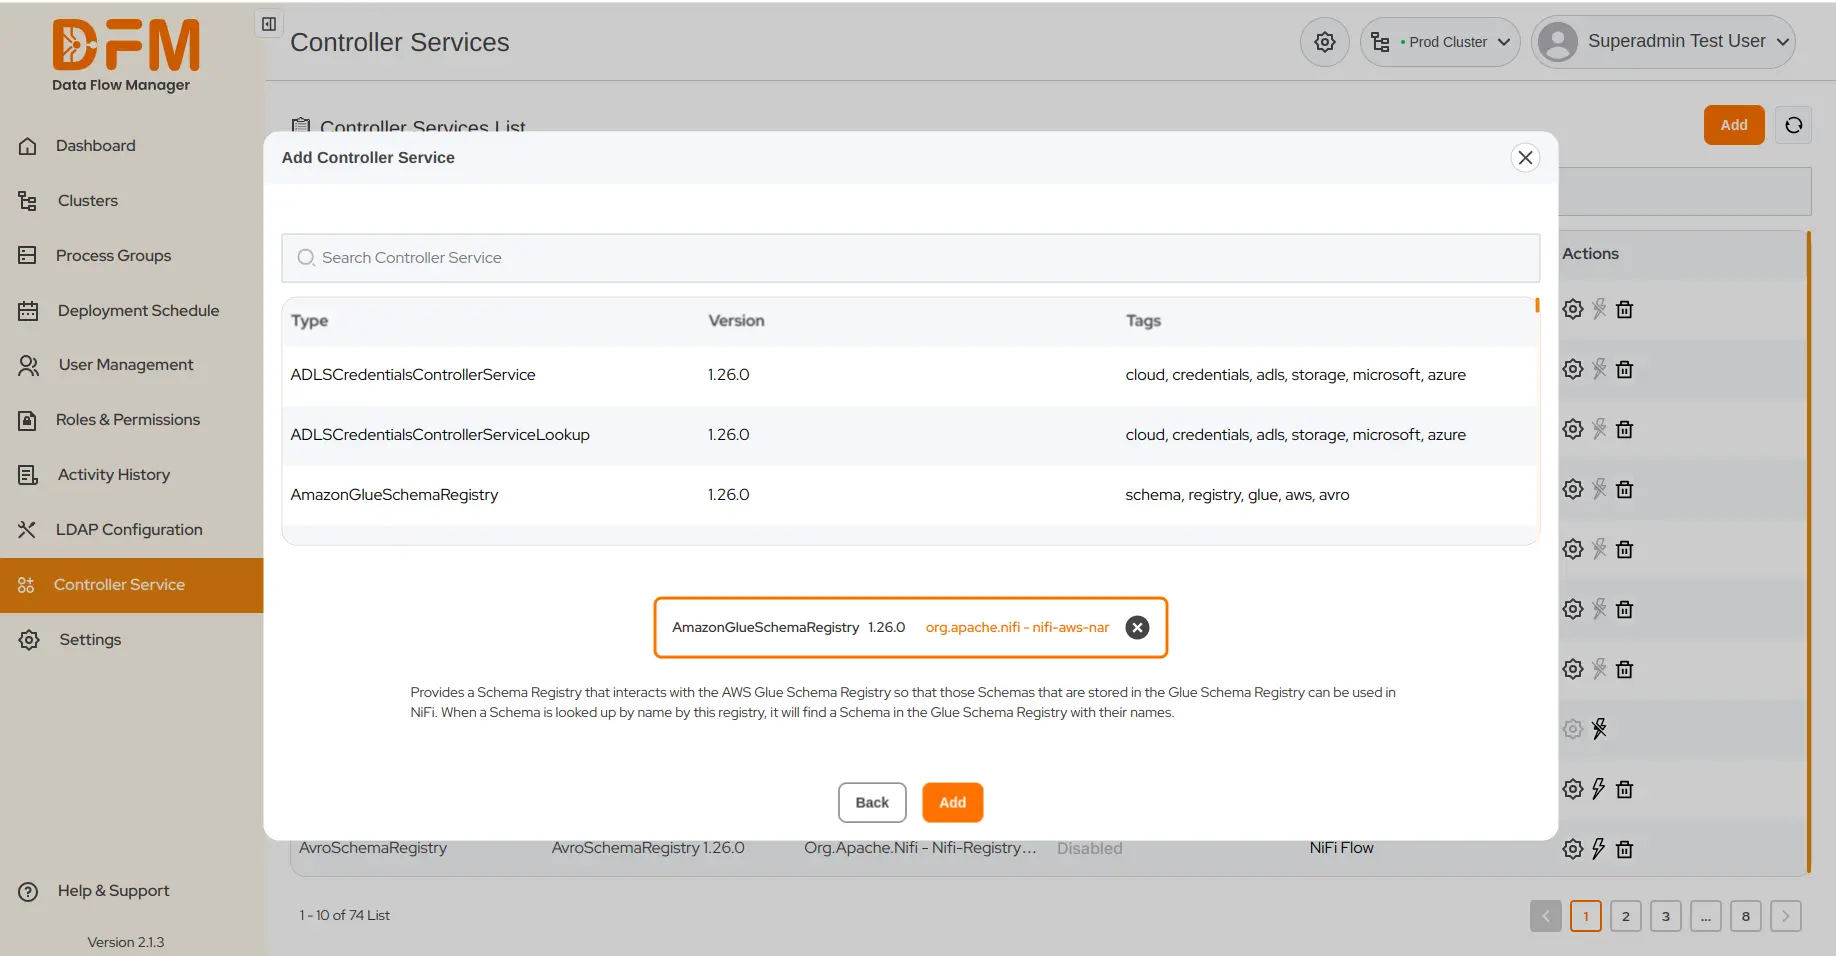
- Click the Add button in the top-right corner.

- Search for the controller service using the search bar or click one from the list. Finally, hit the Add button.
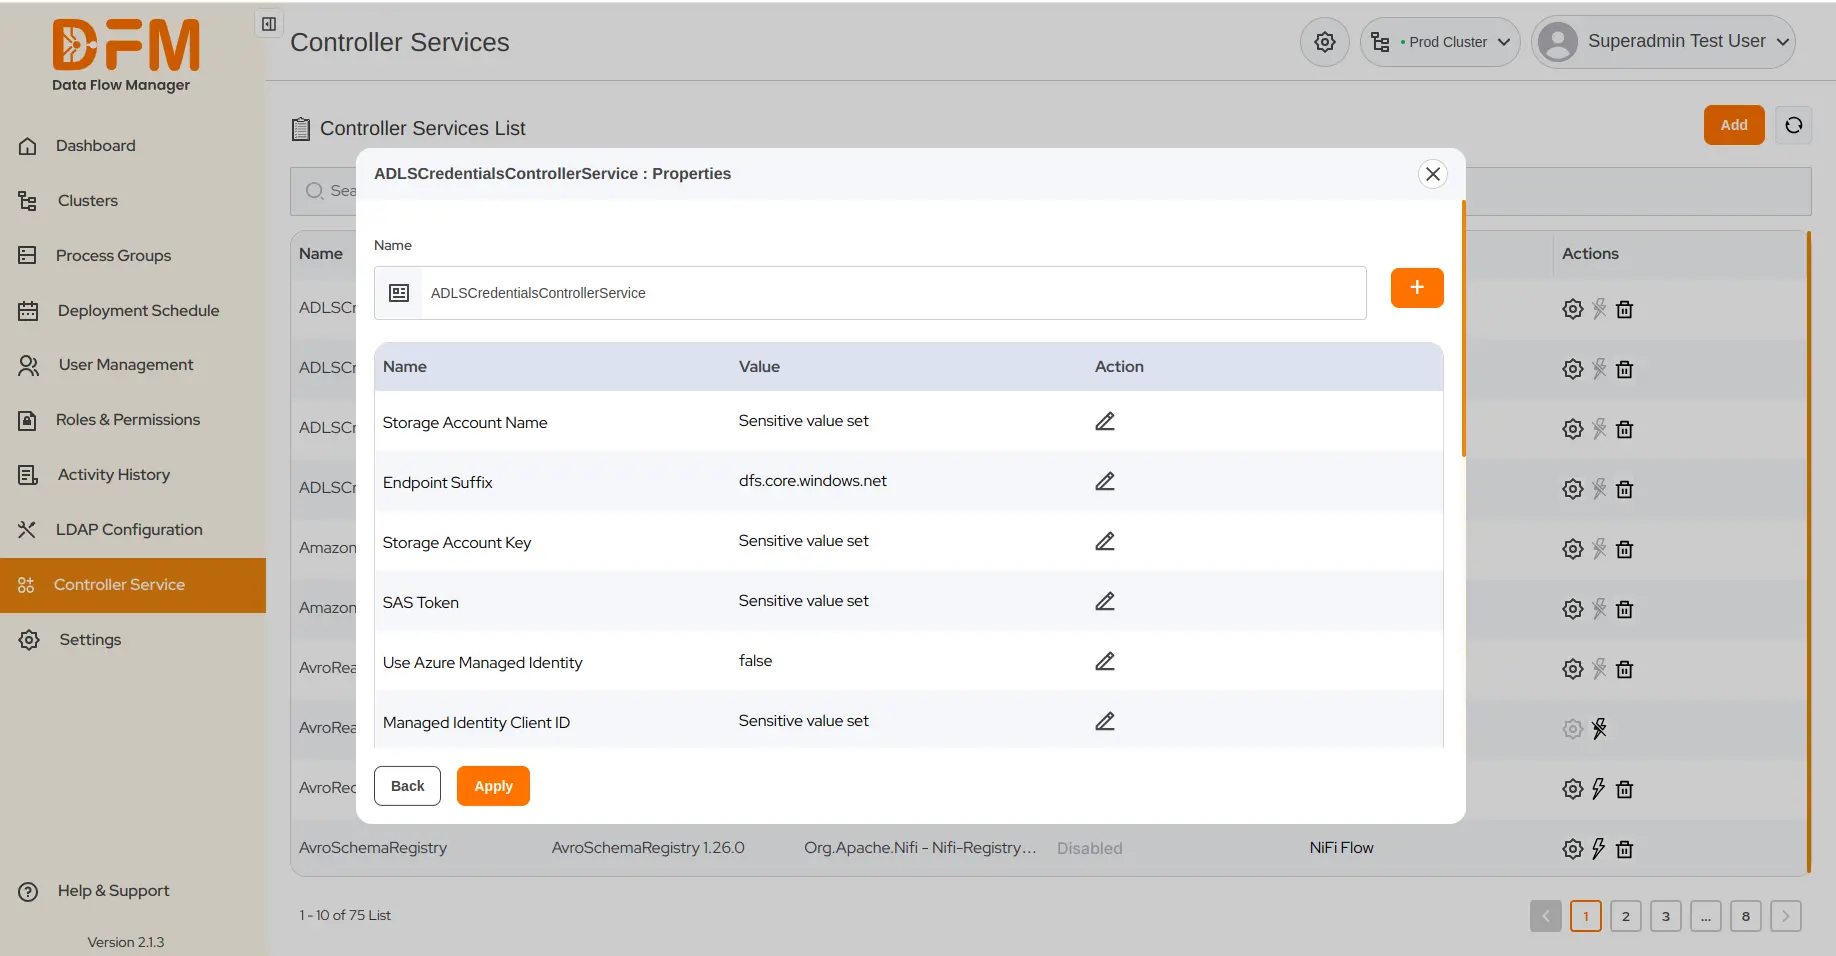
10.2. Update the properties of an existing controller service
To update the properties of a controller service:
- Click the corresponding Settings icon under the Actions columns.
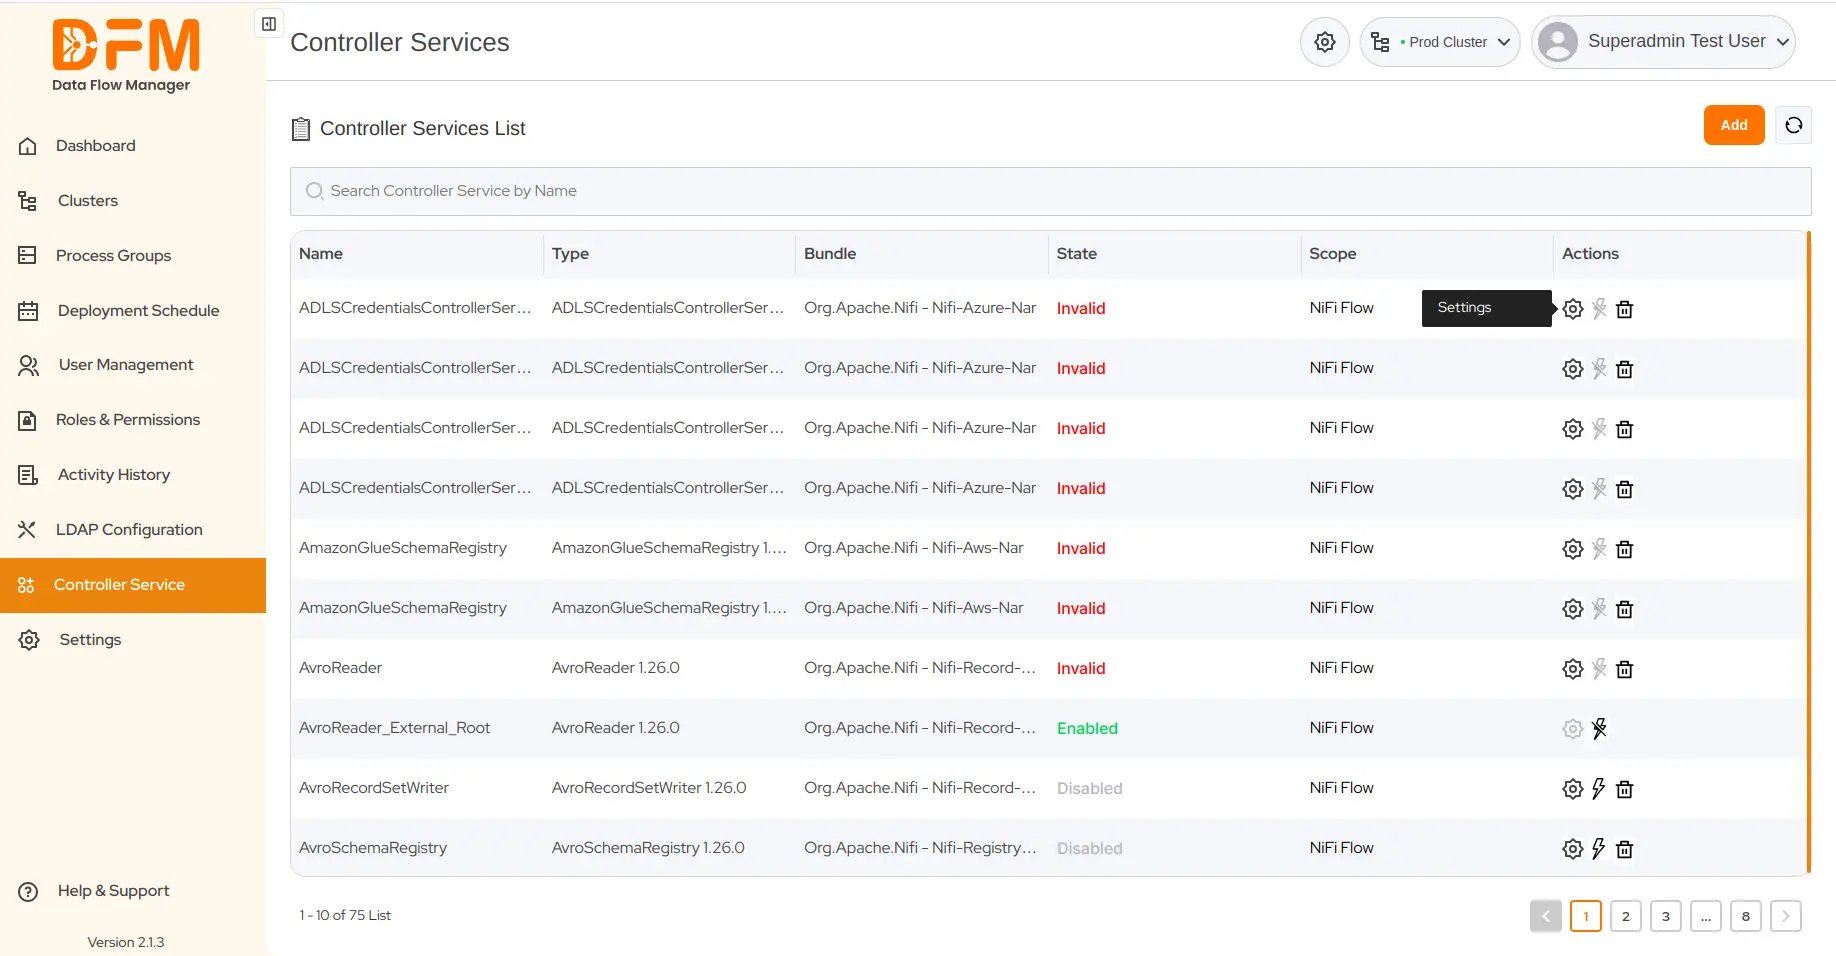
- Edit the values of the properties by clicking on the edit icon, and hit the Apply button.
10.3. Enable or Disable a controller service
To enable or disable a controller service, click on the lightning icon. The controller service will be enabled or disabled accordingly.
11. Settings
All settings can be managed and customized through the Settings Tab, providing you with easy access to configuration options.
- To customize the icon, use the favicon setting. This allows you to choose the icon you want.
- By enabling LDAP Auto-sync, the system will automatically sync LDAP users. This ensures that the user data is up-to-date.
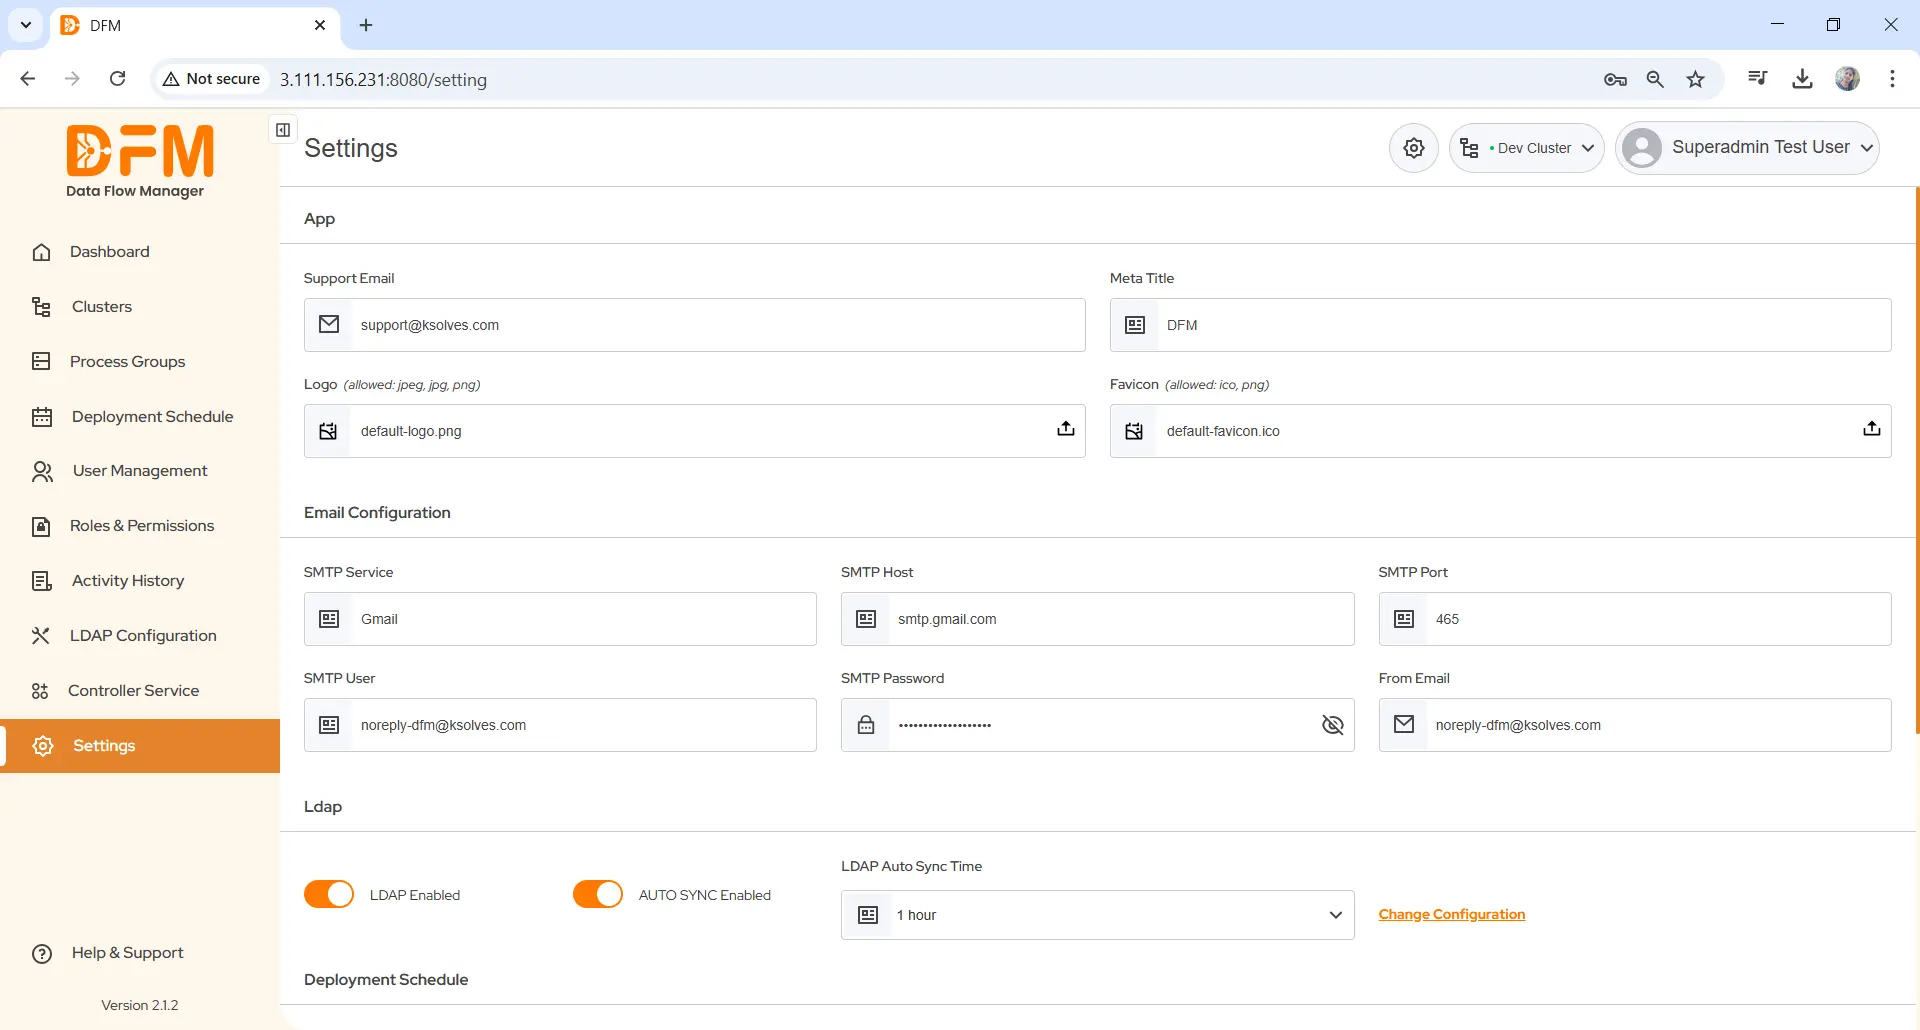
- The Admin Group includes all users with administrative privileges. Members of this group will receive email notifications regarding scheduled deployments.
- An email reminder will be sent before the scheduled deployment. You can set the time for the reminder.
- You can manage and control the Service Account details. This account has full permissions on NiFi, allowing it to perform necessary administrative tasks.
